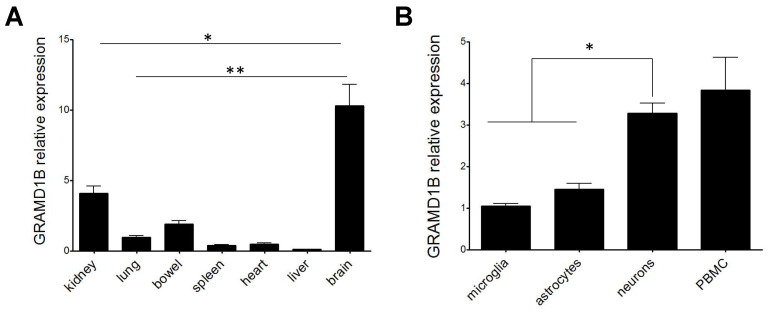
Figure 5.
GRAMD1B expression profile across different rat tissues and cell types. Relative expression of GRAMD1B gene in rat tissues from n = 3 rats (A) and rat cell types (B). Error bars represent SEM. p-values refer to the comparison of expression values between brain and other types of tissues (A) or between neurons and other cell types (B). * p < 0.05, ** p < 0.01.

