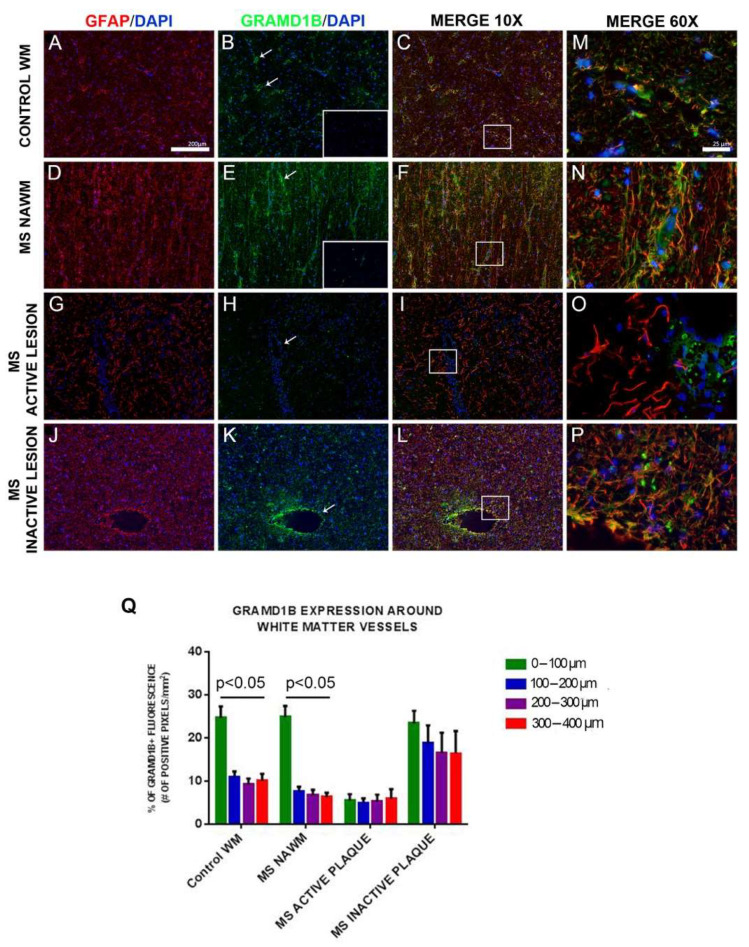
Figure 6.
GRAMD1B expression in astrocytes of human brain tissues from MS and control subjects. Histological analysis of GRAMD1B protein expression on astrocytes in brain autopsied tissues of MS subjects and control subjects without evidence of CNS pathology. GRAMD1B expression is shown in green, and the GFAP astrocyte marker is in red. (A–C) Control subject, normal white matter (NWM). (D–F) MS patient, normal-appearing white matter (NAWM). (G–I) MS patient, active lesion site. (J–L) MS patient, inactive lesion site (10× magnification). (M–P) Higher (60×) magnification of boxed areas shown in the “Merge 10× column”. Isotype controls are represented in boxed areas of B and E pictures. (Q) Quantification of GRAMD1B expression at increasing distances from blood vessels (0–400 µM) in normal white matter (control WM), in MS normal-appearing white matter (MS NAWM), in an active lesion of an MS patient (MS active plaque), and in an MS inactive lesion. Distance from blood vessels: green color: 0–100 µm; blue color: 100–200 µm; pink color: 200–300 µm; red color: 300–400 µm. Arrows in boxes (B,E,H,K) indicate GRAMD1B expression in astrocytes on blood vessels. Error bars represent the SEM. p value refers to the comparison of GRAMD1B expression at different distances from blood vessel in each tissue/lesion type (by Kruskal–Wallis test).

