Figure 8.
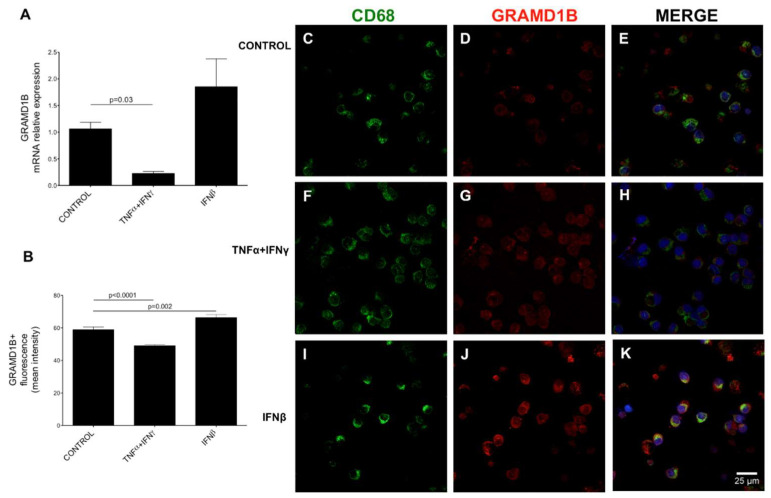
GRAMD1B expression in macrophages/monocytes of control subjects before and after stimulation with inflammatory cytokines. Peripheral blood macrophages/monocytes from four HC blood samples were cultured and stimulated with different inflammatory cytokines. GRAMD1B expression was measured at mRNA level by quantitative RT-PCR (A) and at protein level by immunocytochemistry (B–K). (A) Quantitative RT-PCR quantification of GRAMD1B mRNA expression in basal conditions, after TNFα- and IFNγ stimulation and after IFNβ stimulation. (B) Quantification of the GRAMD1B signal in different fields at resting conditions (control), after TNFα- and IFNγ stimulation and after IFNβ stimulation. (C–E) Unstimulated cells. (F–H) TNFα- and IFNγ-stimulated cells. (I–K) IFNβ-stimulated cells. The panels on the right show the merged staining for GRAMD1B (in red) and the CD68 monocyte marker (in green).

