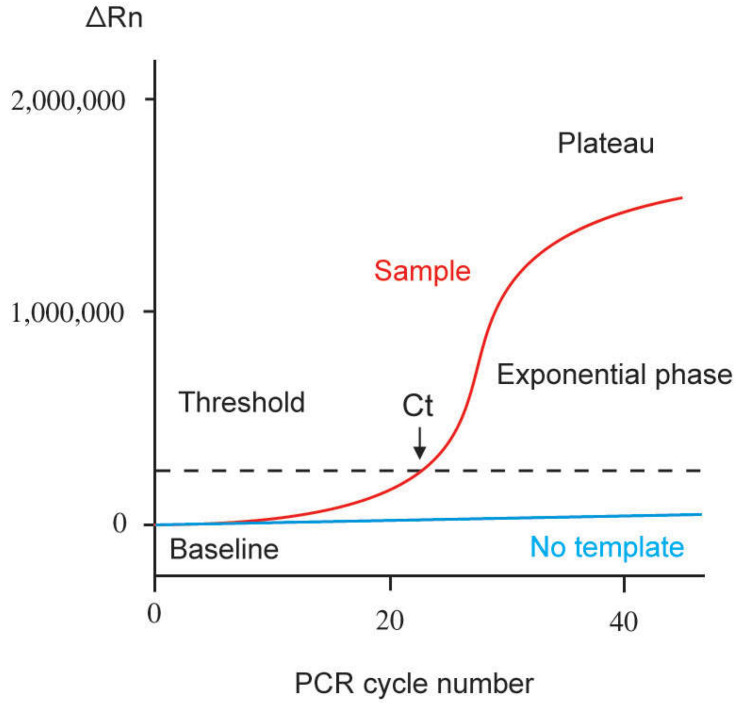
Figure 1.
Representation of a single amplification plot of real-time quantitative PCR. ∆Rn = fluorescence emission of the amplicon at each time point minus fluorescence emission of the baseline. Ct = threshold cycle. Baseline refers to the PCR cycles in which the fluorescent signal of a reporter accumulates. However, it is below the limits of detection of the instrument (adapted from Arya et al. [5]).

