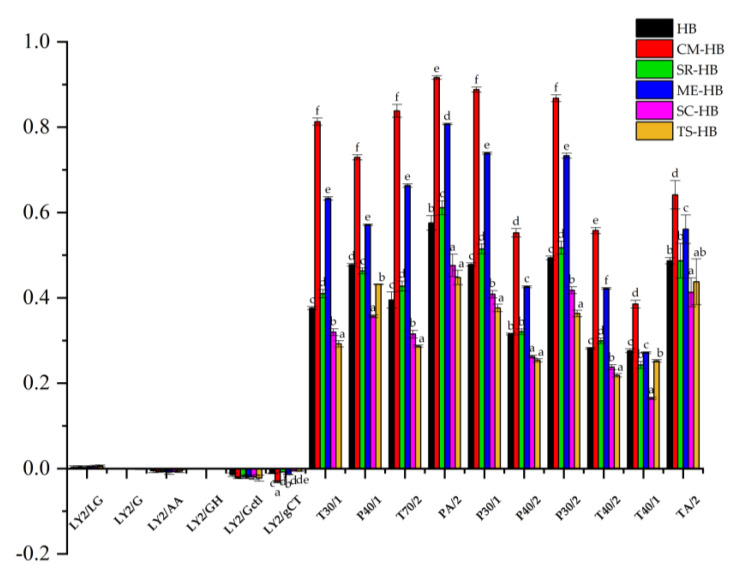
Figure 1.
E-nose response value plot for original and fermented highland barley samples: HB (original highland barley), CM-HB (fermented highland barley with C. militaris), SR-HB (fermented highland barley with S. rugoso-annulata), ME-HB (fermented highland barley with M. esculenta), SC-HB (fermented highland barley with S. commune), TS-HB (fermented highland barley with T. sanguinea). Different superscript lowercase letters in a row (a–f) represent statistically significant differences between the mean values at p < 0.05 determined by one-way ANOVA.

