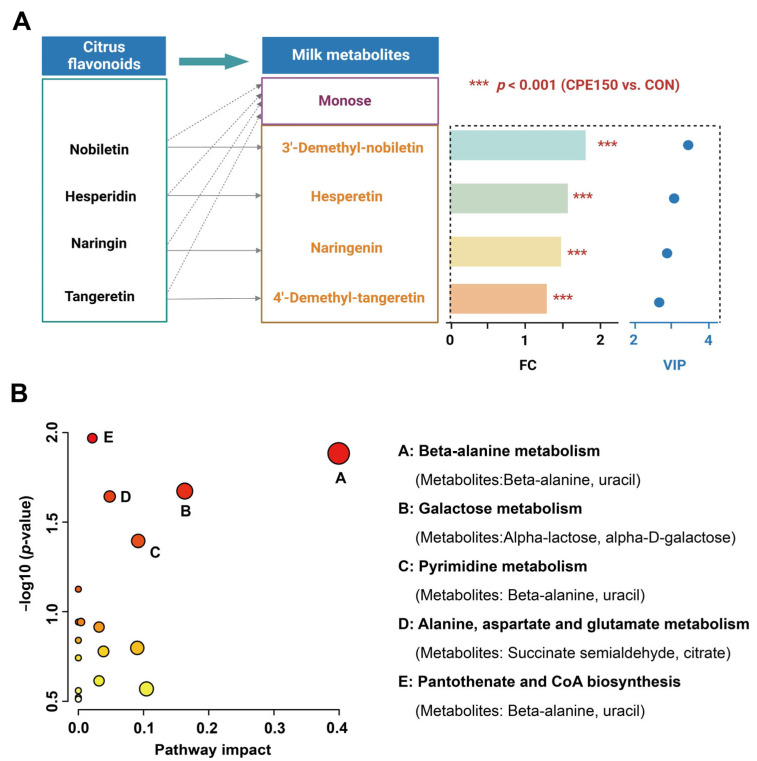
Figure 6.
Key differentially expressed metabolites analysis. (A) The aglycones of flavonoids were enriched in the milk of dairy cows fed the supplementary citrus peel extracts at 150 g/d (CPE150) in comparison with the control diet (CON); Blue points indicate VIP values of metabolites (B) Overview of pathway analysis based on the differentially expressed metabolites between the milk of dairy cows fed the CON vs. CPE150. FC, fold change; VIP, variable importance in the projection.

