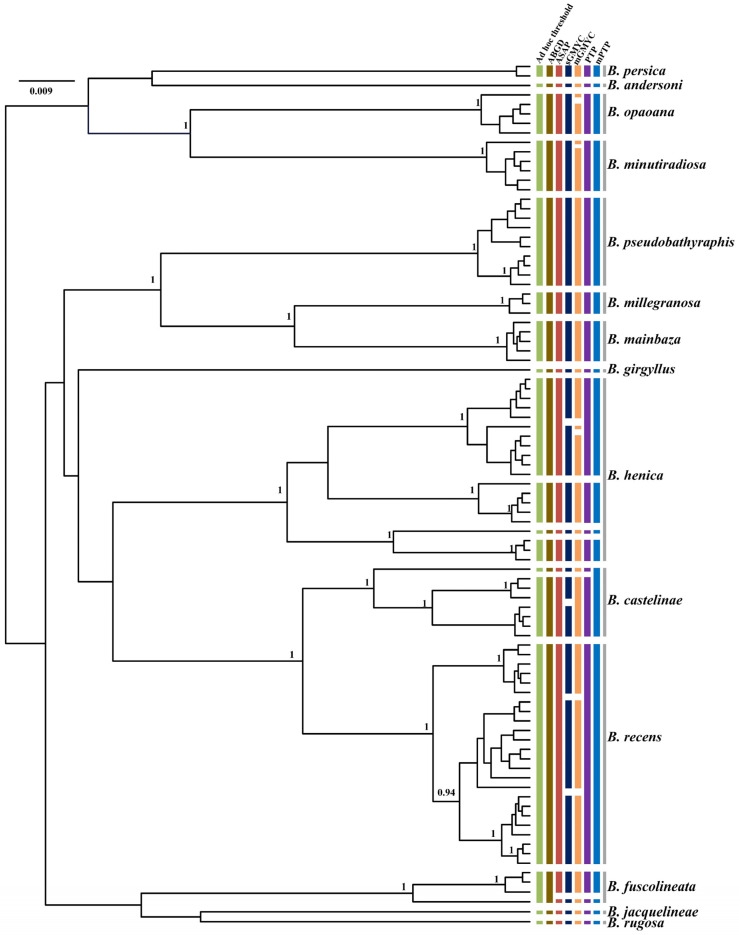
Figure 7.
Comparison of species delimitation results of Bolma based on analysis of COI sequences of 91 individuals from 14 different nominal species, with lineage assignments from the four tree-based (PTP, mPTP, sGMYC, mGMYC) and three distance-based (ad hoc threshold, ABGD, ASAP) methods. Each colored bar represents a species delimited by each method tested and gray bars represent nominal species. Gene tree is from a BEAST analysis and MCC tree is shown. Node values represent Bayesian posterior probabilities (≥0.95) for major clades.

