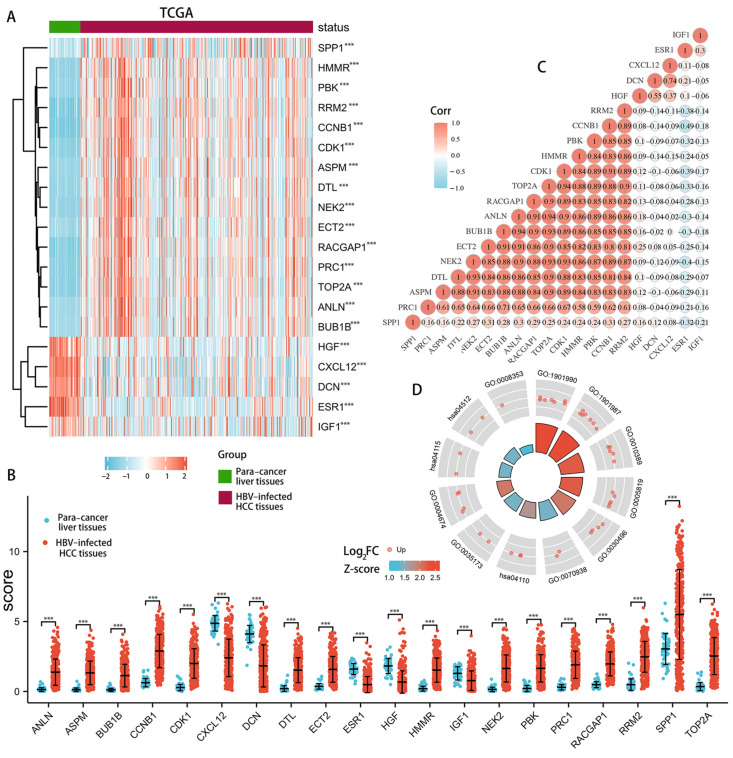
Figure 5.
Expression validation of candidate hub genes in TCGA database. Heatmaps of hub genes expressed in tumors and adjacent normal tissues in patients with HCC (A). Validation of the expression level of hub genes in patients with HCC (B). The correlation matrix of interaction in hub genes. Correlation coefficients are plotted with negative correlation (blue) and positive correlation (red) (C). Functional enrichment analysis of the up-regulated hub genes (D). GO 1901990: regulation of mitotic cell cycle phase transition; GO 1901987: regulation of cell cycle phase transition; GO 0010389: regulation of G2/M transition of the mitotic cell cycle; GO 0005819: spindle; GO 0030496: midbody; GO 0070938: contractile ring; GO 0004674: protein serine/threonine kinase activity; GO 0008353: RNA polymerase II CTD heptapeptide repeat kinase activity; hsa04110: cell cycle; hsa04115: p53 signaling pathway; hsa04512: ECM–receptor interaction. *** p < 0.001.

