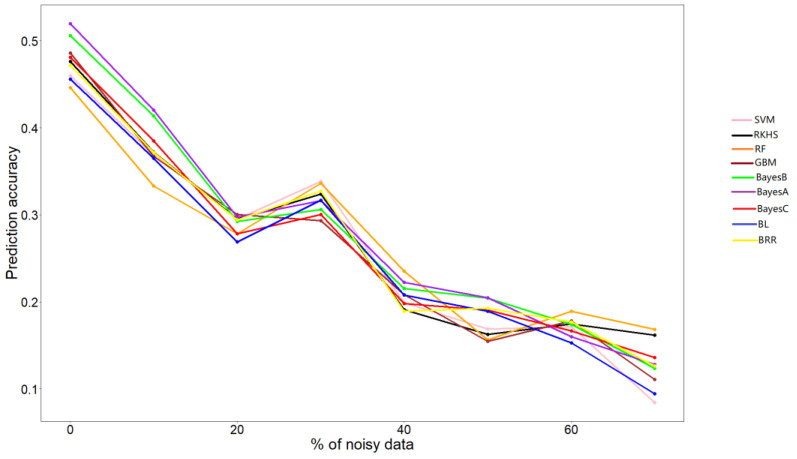
Figure 2.
Prediction accuracy of each algorithm when noisy data is added to the phenotype. The O. niloticus weight-trait dataset was used. The percentage of noisy data included in the phenotype data and the prediction efficiency evaluated by Pearson correlation coefficient are represented in the X and Y axes, respectively.

