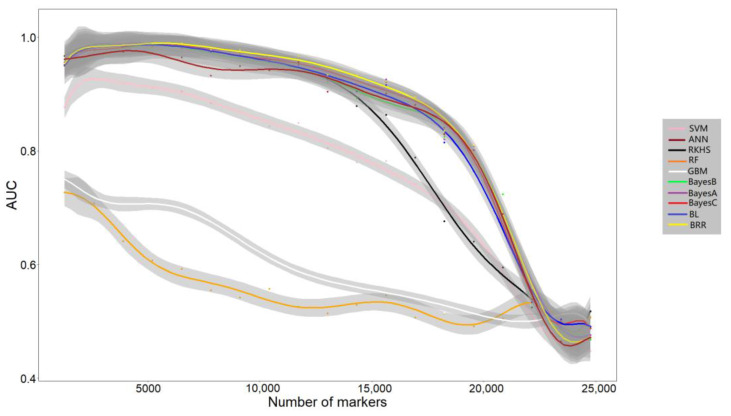
Figure 3.
Prediction efficiency of each algorithm when using GWAS to select subsets of significant SNPs. The dataset of C. gigas was used. The number of markers used and the prediction efficiency evaluated by AUC (area under the curve) are represented in the X and Y axes, respectively. The grey area indicates 90% confidence interval.

