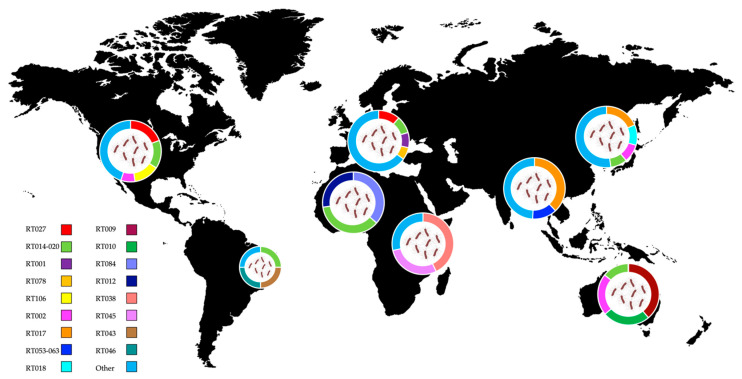
Figure 1.
Distribution of C. difficile ribotypes in the United States, South America, Europe, North and Central Africa, Asia and Australia. Data are shown in pie charts as percentage, from studies covering different countries [93,94,95] or single country [96,97,98,99,100]. The smaller pie chart is representative of a single hospital study. The world map was obtained from Freepik.com. See also Table S1 for the toxin gene profile of listed ribotypes.

