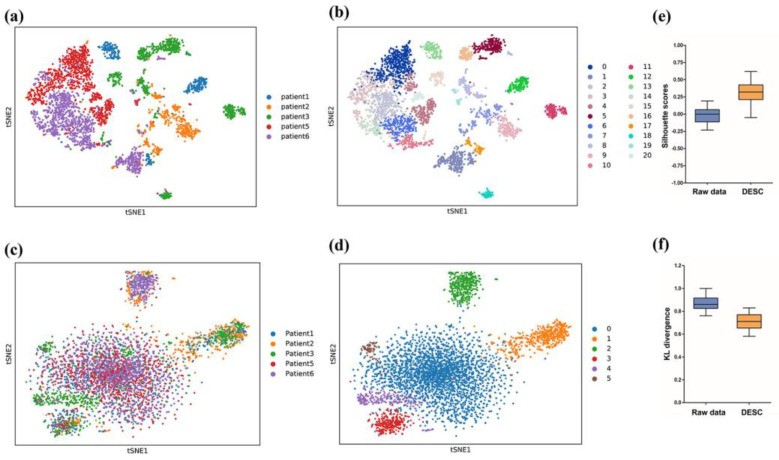
Figure 1.
Batch correction and evaluation of multi-batch, integrated scRNA-seq data collected from ascites samples of patients with EOC. (a,b) T-SNE view of ascites samples before DESC correction, colored by batch ID (a) and cell clusters (b). (c,d) T-SNE view of ascites samples after DESC algorithm correction, colored by batch ID (c) and cell clusters (d). (e,f) Box plot of silhouette scores (e) and KL divergence (f) in raw data and data after DESC correction.

