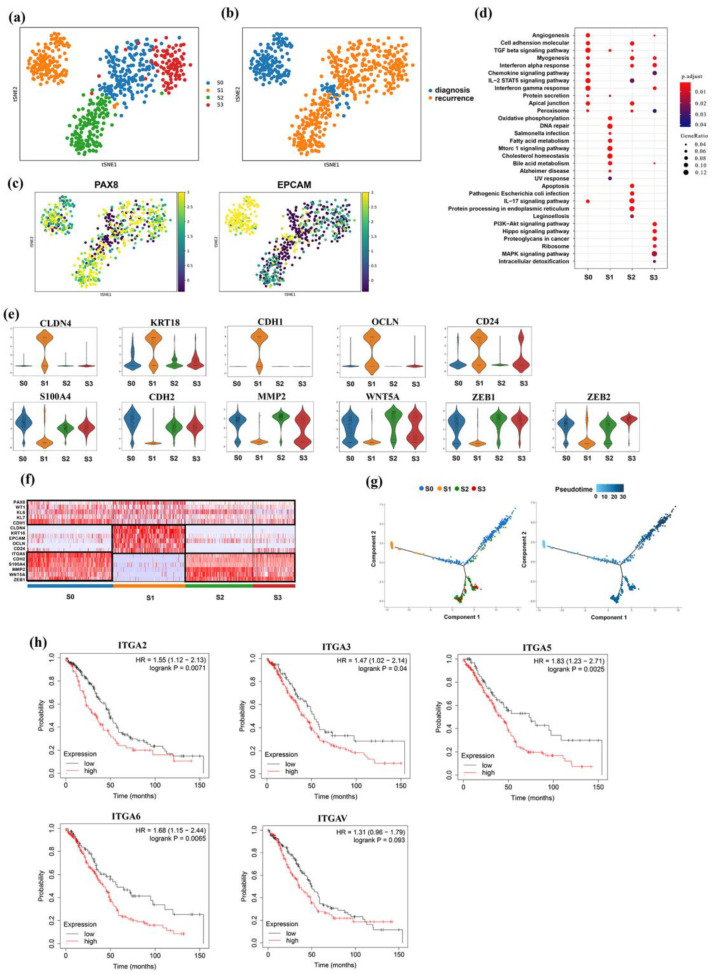
Figure 3.
Identification of mesenchymal cancer cells in the progression of EOC. (a,b) T-SNE view of four subgroups of cancer cells, colored by subgroups (a) and sample groups (b). (c) The expression of PAX8 and EPCAM in the t-SNE map of diverse cancer cell subgroups. (d) Differential activated pathways among four subgroups of cancer cells. (e) Expression levels of epithelial mesenchymal transition markers in each cancer cell subgroup were plotted in violin plots. (f) Heatmap of representative markers for epithelial and mesenchymal cancer cells. (g) Pseudotime analysis demonstrates a differentiated trajectory from S1 to S0, S2, and S3. (h) Kaplan–Meier survival curves of integrin genes in TCGA and GEO meta-data.

