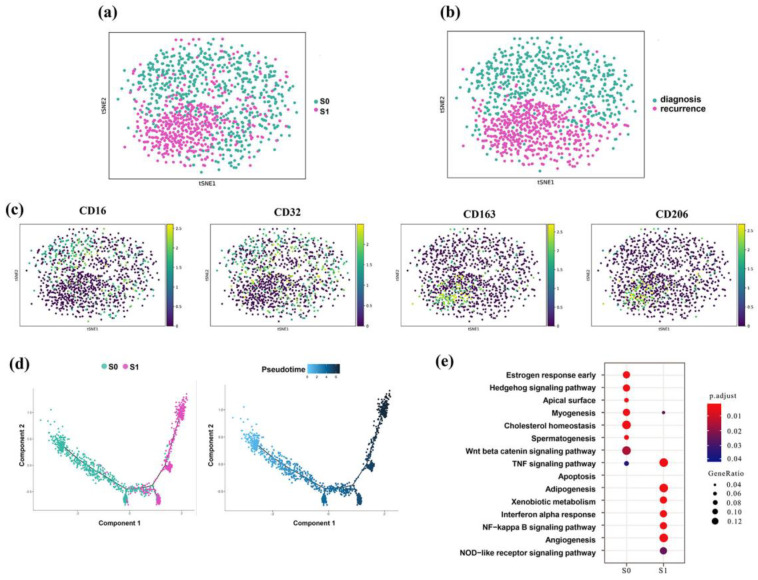
Figure 4.
Infiltration of M2 macrophages in EOC progression. (a,b) T-SNE map of subcluster analysis for macrophages, colored by cell types (a) and sample groups (b). (c) Canonical markers for the M1 macrophage and M2 macrophage. (d) Pseudotime graph of two subgroups of macrophages inferred by Monocle 2. (e) Differential activated pathways among the two subgroups of macrophages.

