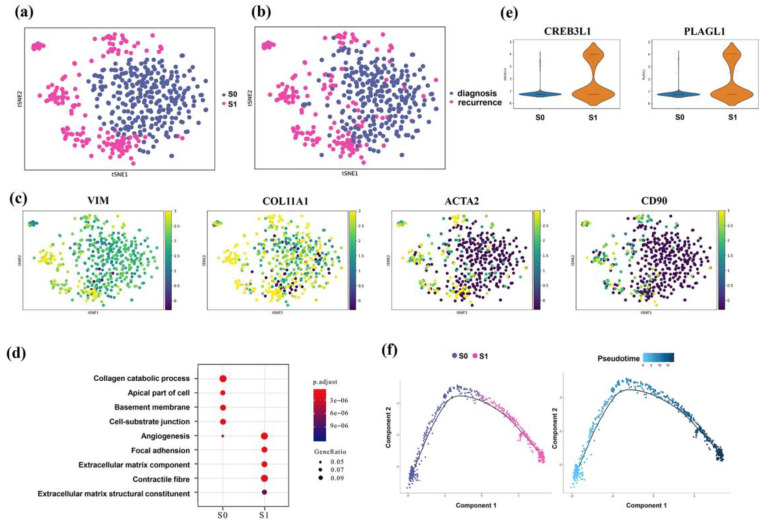
Figure 5.
Activation of the cancer-associated fibroblast subset in EOC progression. (a,b) T-SNE view of fibroblasts, colored by cell types (a) and sample groups (b). (c) General stromal markers for fibroblasts and representative markers for ACTA2-positive fibroblasts. (d) Functional analysis of differentially expressed genes among the two subtypes of fibroblasts. (e) Vlnplots show the expression of genes that regulate ECM formation and components across the two fibroblast subtypes. (f) Pseudotime trajectory of the two subgroups of fibroblasts inferred by Monocle 2.

