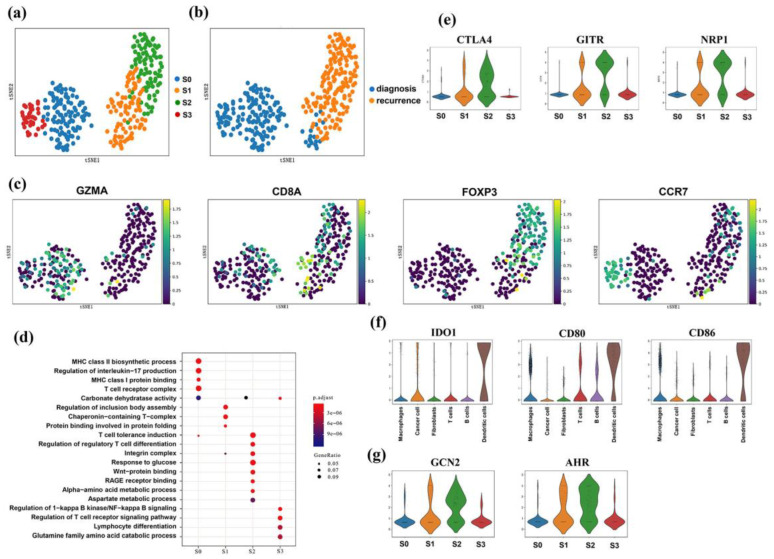
Figure 6.
ScRNA-seq revealed heterogeneity in T immune cells. (a,b) T-SNE map of subcluster analysis for T immune cells, colored by cell types (a) and sample groups (b). (c) T-SNE maps show canonical markers for four T immune cell subtypes: GZMA for CD8+ T effector cells; CD8A for CD8+ T naïve cells; CCR7 for CD4+ T conventional cells; FOXP3 for CD4+ CD25+ T regulatory cells. (d) Functional analysis of differentially expressed genes among four subtypes of T cells. (e) Expression levels of other representative marker genes for CD4+ CD25+ T regulatory cells. (f) Dendritic cells highly expressed the IDO-related genes. (g) Tryptophan metabolism pathway-related genes were highly expressed in Treg cells.

