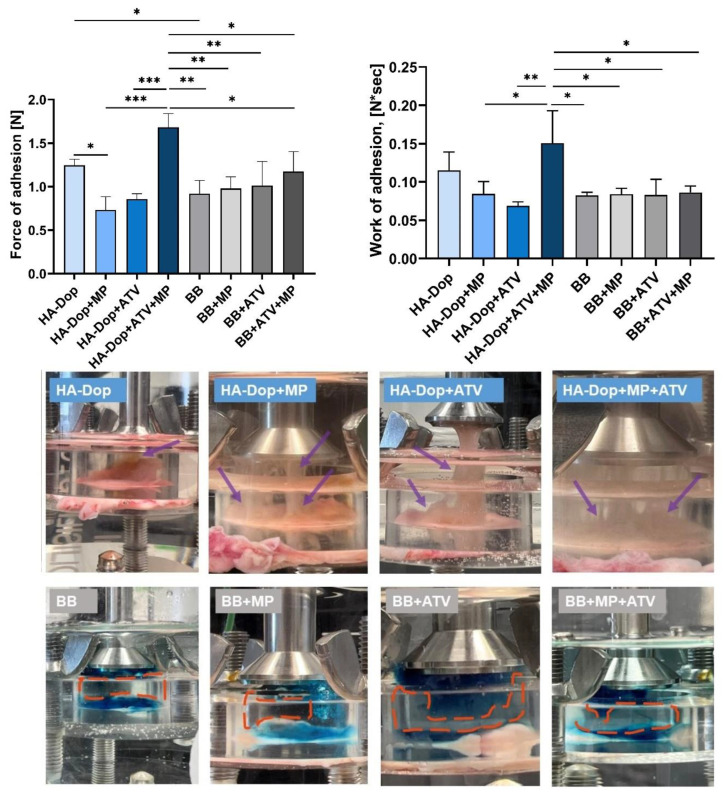
Figure 4.
Upper panel, left: maximum of the force of adhesion [N] of the HA-Dop and control formulations, measured with texture analyzer. Right: work of adhesion [N*sec] of the formulations. All row means were analyzed by one-way ANOVA and unpaired two-tailed t-tests. Bottom panel: photos, taken a few seconds after the detachment of the probe. N = 3, error bars = SD, * p ≤ 0.05; **: p ≤ 0.01; ***: p ≤ 0.001.

