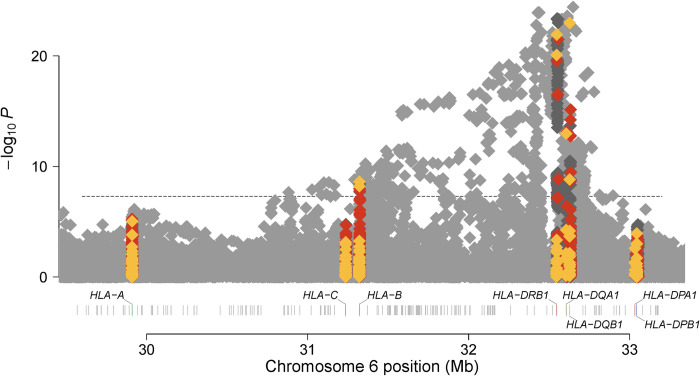
Fig 1. Manhattan plot for marginal additive association between variation within the MHC and MS risk in the Hispanic sample.
Genomic position (HG19) is denoted on the x-axis and -log(10) P-value for the association of an additive effect of each SNP (grey), classical allele (yellow), and amino acid (orange) with MS risk on the y-axis.

