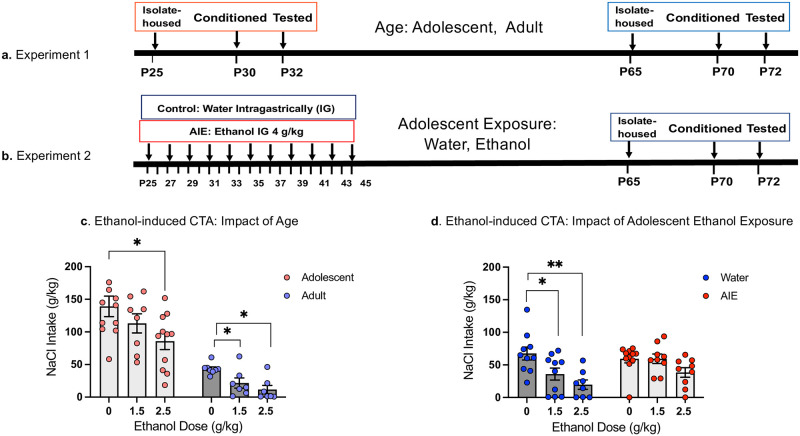
Fig 1. Timelines and NaCl (CS) intake on test day in Experiment 1 and Experiment 2.
Timelines for Experiments 1 and 2, respectively (a, b), and NaCl (CS) intake (g/kg) on test day (c, d, respectively) are shown. Asterisks depict significant changes in NaCl intake on test day within each Age relative to controls conditioned with saline (0 g/kg EtOH dose), *—p < 0.05, **—p <0.01.

