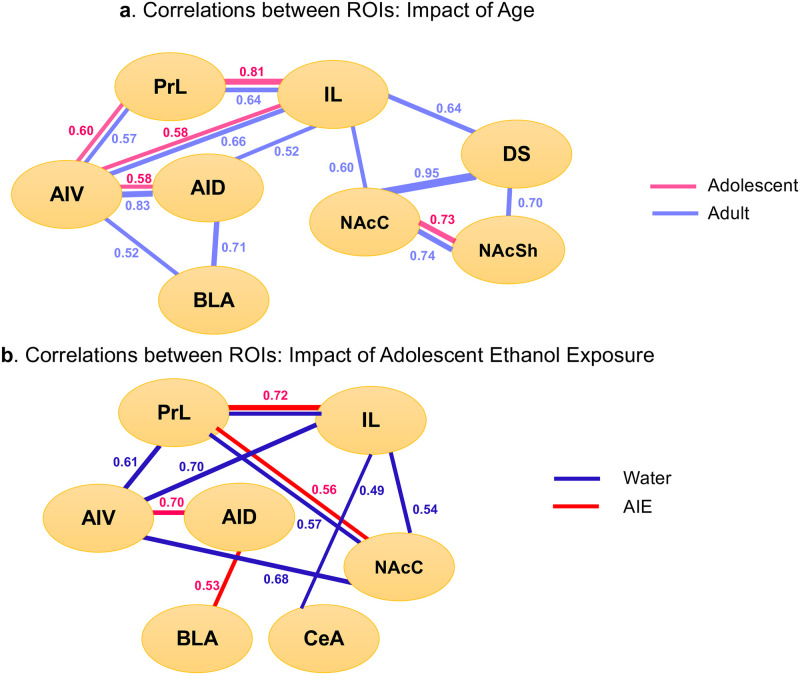
Fig 4. Correlation matrices as a measure of functional connectivity between brain regions.
Functional connectivity is shown for adolescents and adults in Experiment 1 (a) and water and AIE exposed adults in Experiment 2 (b). Only significant (p <0.05) correlations are presented, number represent r values.

