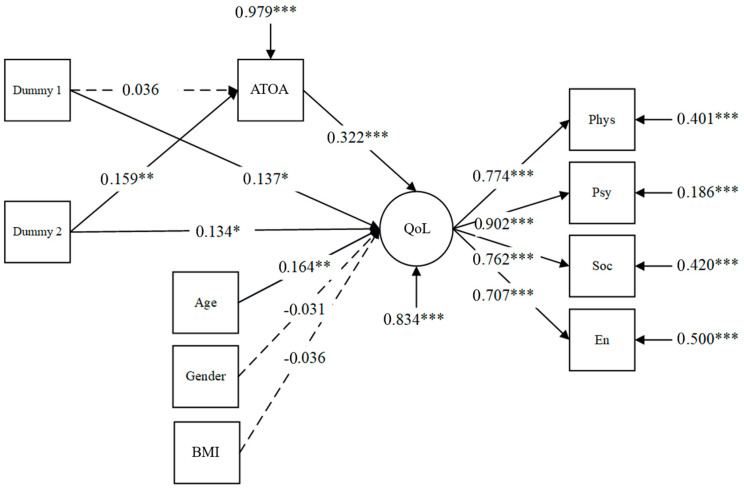
Figure 2.
Structural model for QoL. Note: The circles represent latent variables, and rectangles are observed variables. The broken lines indicate effects that are not statistically significant. Path coefficients are standardized MPLUS parameter estimates. The subdomains of QoL scales are: Phys = physical, Psy = psychological, Soc = social, En = environmental. * p < 0.05; ** p < 0.01; *** p < 0.001.

