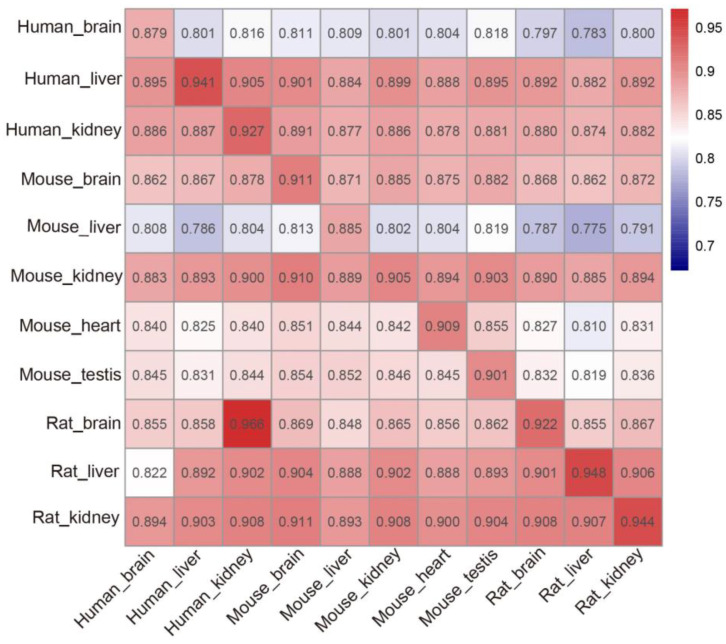
Figure 6.
The heat map showing the cross- and intra-tissue prediction AUROC values. Once a tissue-specific model was established on its own training dataset in rows, it was validated on the data from the same tissue as well as the independent data from the other tissues of the three species in columns.

