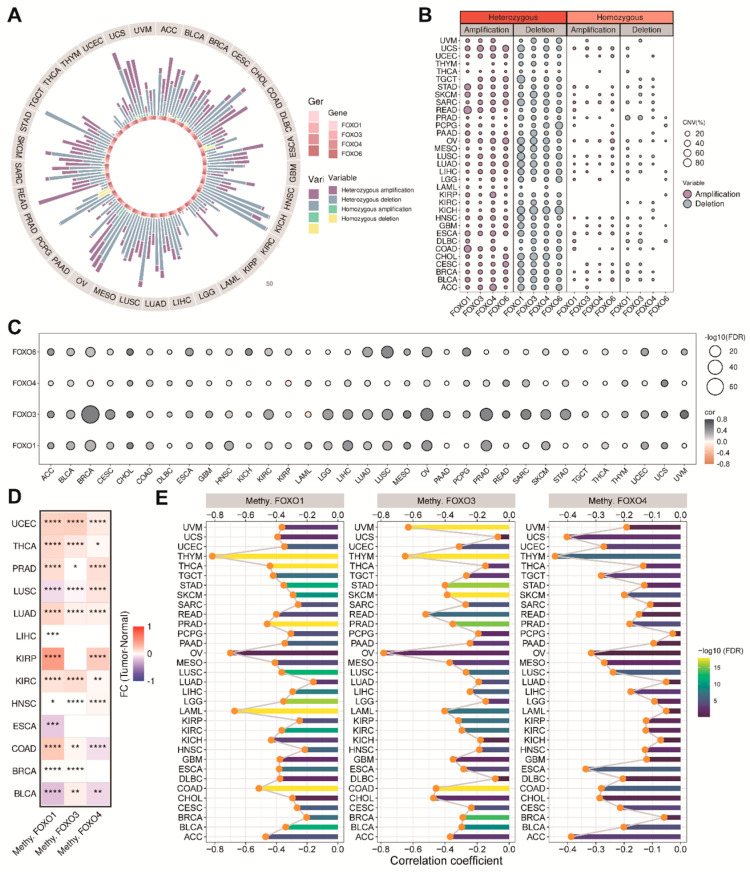
Figure 3.
The CNV alteration and the methylation levels of FOXO family genes. (A) The CNV percentage of FOXO family in each tumor type. (B) The heterozygous and homozygous CNV profile of FOXO family in each tumor type, including the percentage of amplification and deletion. (C) Bubble plot of the correlations between CNV and mRNA expression of FOXO family in pan-cancer (FDR, false discovery rate). (D) Heatmap of the different methylation levels of FOXO family in pan−cancer (FC, fold change; * p < 0.05, ** p < 0.01, *** p < 0.001, **** p < 0.0001). (E) Bar plot of the correlations between the methylation levels and mRNA expression of FOXO family in pan−cancer (FDR, false discovery rate).

