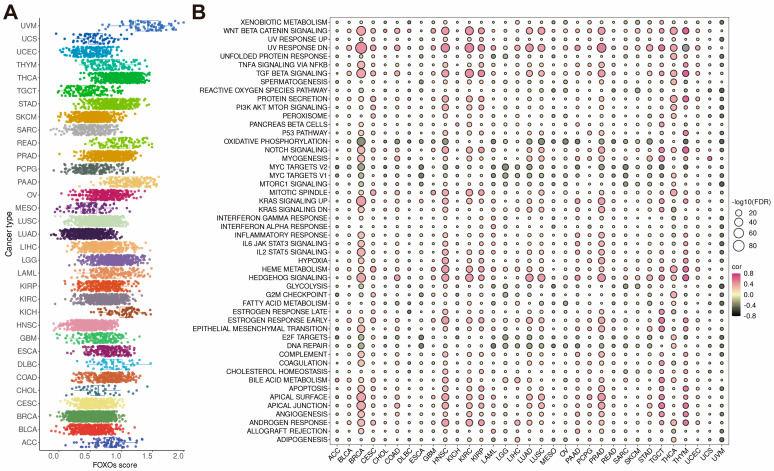
Figure 4.
The FOXOs score distribution and the correlations between FOXOs score and hallmark pathways. (A) The FOXOs score distribution in the TCGA pan−cancer cohort. (B) Bubble plot of the correlations between FOXOs score and hallmark pathways in each tumor type. Pink indicates a positive correlation and black indicates a negative correlation. (FDR, false discovery rate).

