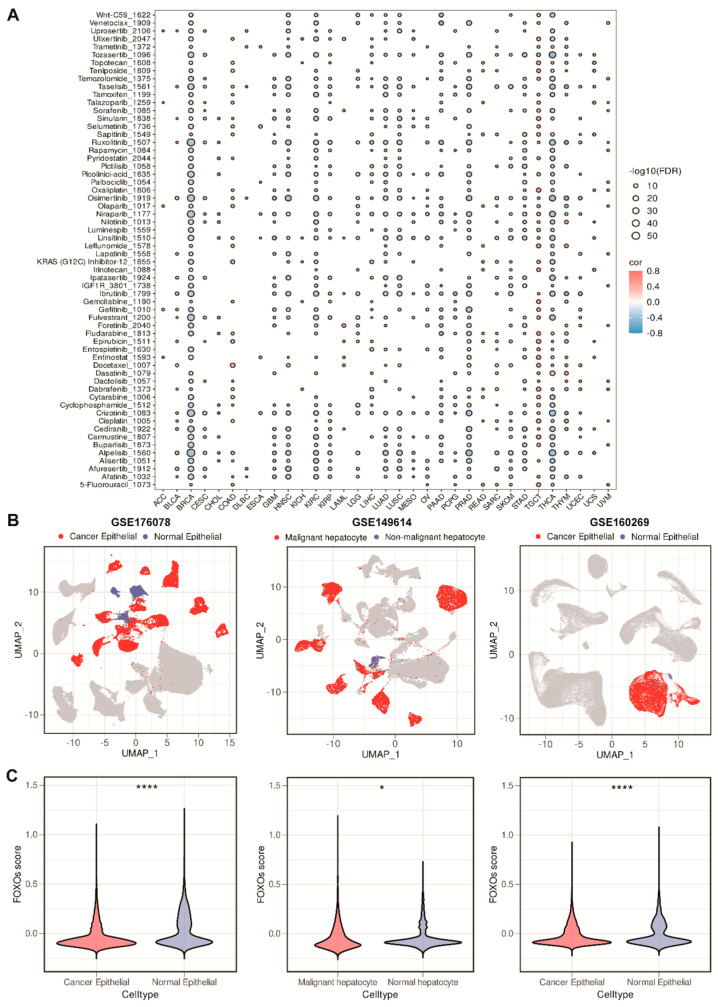
Figure 8.
The correlations between FOXOs score and drug sensitivity and single–cell RNA transcriptome analysis of the distribution of FOXOs score. (A) Bubble plot of the correlations between FOXOs score and IC50 values of common drugs (FDR, false discovery rate). (B) UMAP plot visualization of the distribution of FOXOs score between malignant and normal epithelial cells in GSE176078, GSE149614, and GSE160269. (C) Violin plots of the FOXOs score between malignant and normal epithelial cells in GSE176078, GSE149614, and GSE160269 (* p < 0.05, and **** p < 0.0001).

