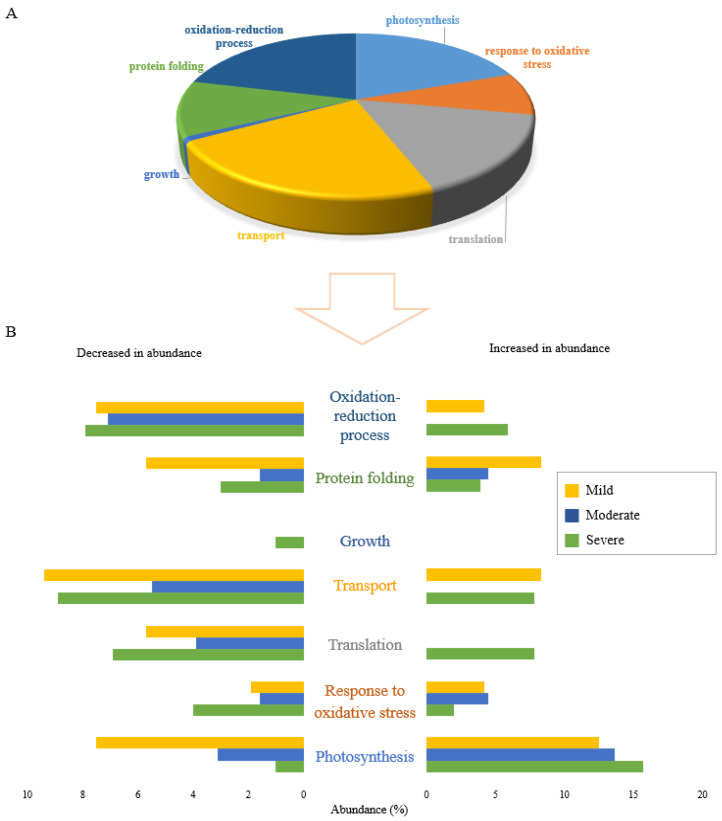
Figure 3.
Functional classification of proteins differentially accumulated in response to drought stress levels, specific to each of severe, moderate, and mild drought stresses. (A) The pie chart shows the percentage of biological functions of 378 proteins significantly changed uniquely under different drought stress levels. (B) The bar graph shows the abundance of proteins in percentage in 7 functional categories that are uniquely altered in response to drought stress levels including severe, moderate, and mild drought treatments. Distinct colours represent various levels of field capacity in drought stress: severe drought specific (green), moderate drought specific (blue) and mild drought specific (yellow).

