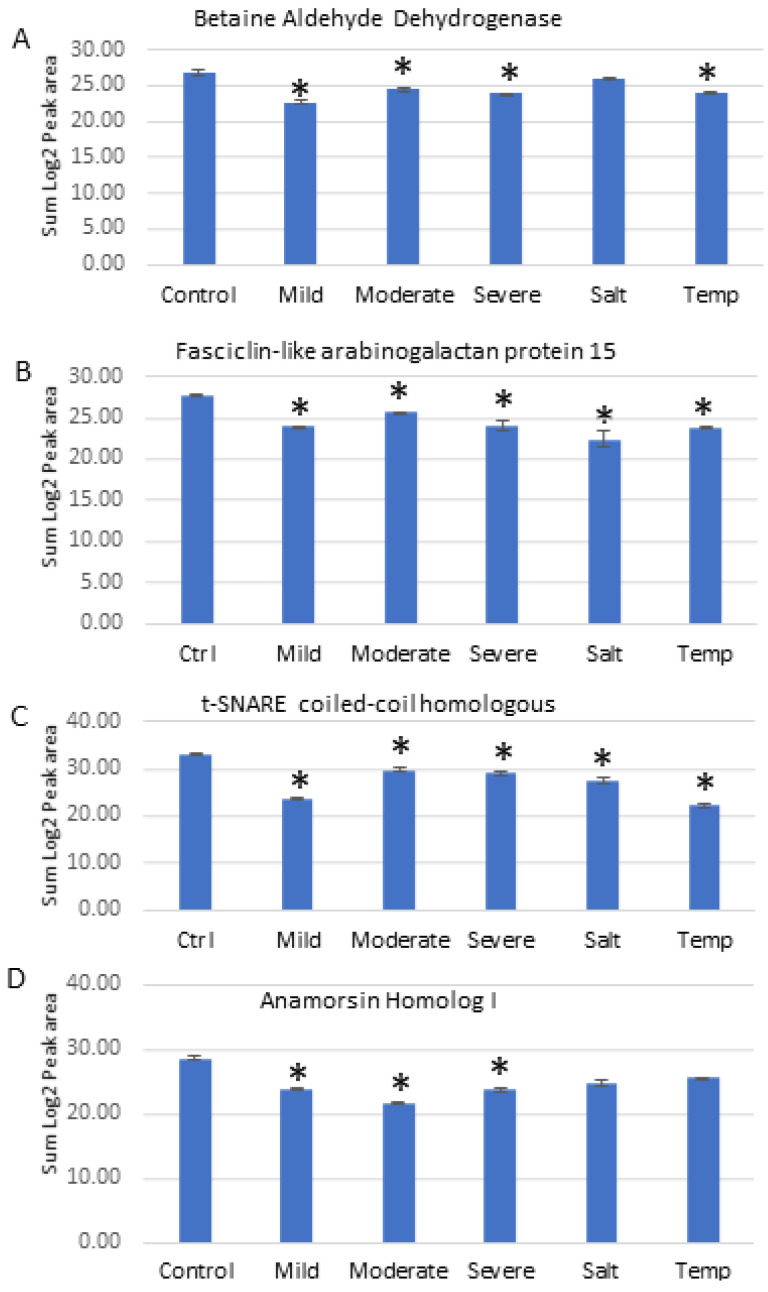
Figure 6.
PRM validation of four proteins changed in abundance in response to abiotic stresses in Nipponbare plants. (A) = Betaine aldehyde dehydrogenase, (B) = Fasciclin-like arabinogalactan protein 15, (C) = t-SNARE coiled-coil homologous protein, (D) = Anamorsin homolog 1. Bars illustrate the relative abundance of proteins under control conditions, followed by mild, moderate and severe drought stresses, salt stress and temperature stress treatments. Y-axis indicates summed log2 peak area, which illustrates relative abundance, error bars indicate standard deviation. An asterisk (*) indicates a statistically significant difference between the control and stress condition, according to a Student t-test (p-value < 0.05).

