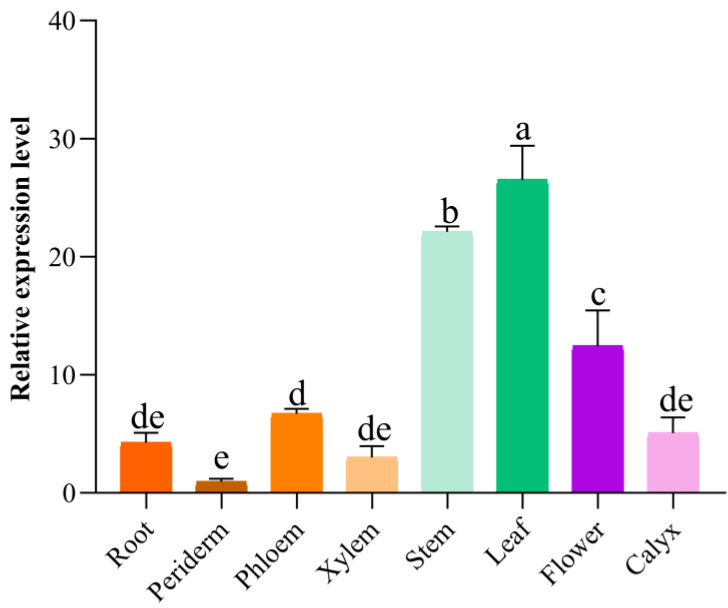
Figure 1.
Expression profiles of SbMYB12 in different tissues of S. baicalensis. The data represent the means of three biological replicates, and the error bars indicate the standard deviation (SD). Significant differences between means were identified (depicted by different letters; p < 0.05) using one-way ANOVA (followed by Tukey’s comparisons).

