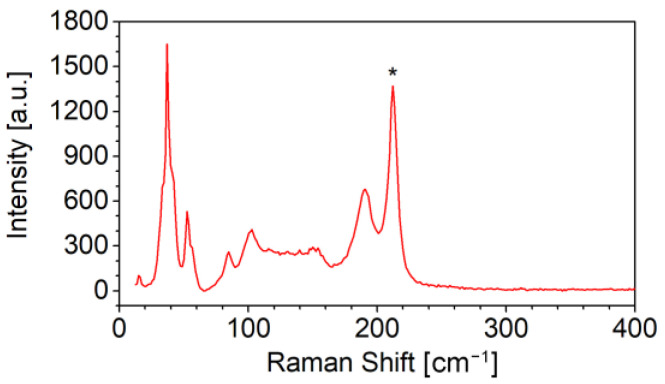
Figure 1.
Raman spectrum collected on a local spot of a thin-film deposited by LT-PED with a Sb1.5Cu0.5Se3 target, where CuSbSe2 phase was also present, as revealed by the peak at ~210 cm−1 (highlighted with * symbol). All the other main peaks in the spectrum are typical of a Sb2Se3-like phase [36].

