Figure 6.
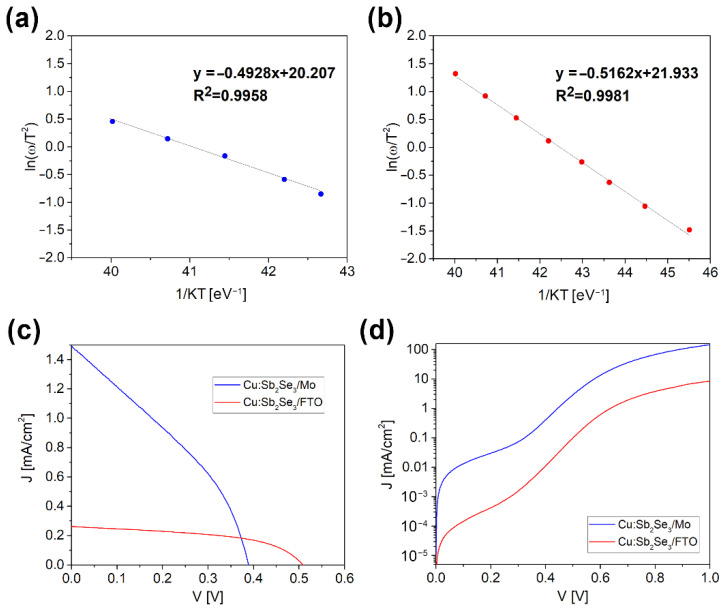
Electrical characterization of the two cells with Cu-doped Sb2Se3 on Mo (Glass/Mo/Cu:Sb2Se3/CdS/ZnO/AZO) and on FTO (Glass/FTO/Cu:Sb2Se3/CdS/ZnO/AZO) with the highest recorded Voc values: Arrhenius plots of ln (w/T2) vs 1/KT calculated from the C vs w spectra in the 250K-300K temperature range for the cell on Mo (a); and on FTO (b). J-V plot for the two cells under illumination (c); and in the dark (d).

