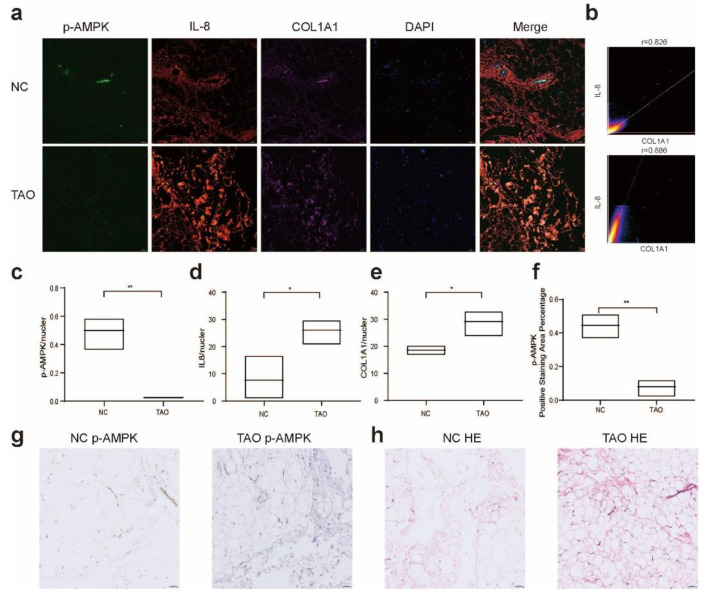
Figure 1.
Alterations in AMPK activity in TAO orbital connective tissue. (a) Four-color IF analysis showing IL-8 (red), p-AMPK (green), COL1A1 (purple), and nuclei (blue) in the connective tissue of TAO and NC samples. Colocalization of p-AMPK, inflammation and fibrosis markers in orbital tissues of different populations. Scale bar, 50 µm. (b) Scattergrams indicate the fluorescence intensity and Pearson’s correlation (r) of IL-8 and COL1A1 in the image in (a). (c–e) Ratio of the fluorescence intensity of p-AMPK, IL-8, and COL1A1 to nuclei. (f) Average optical density (AOD) of p-AMPK in each group shown in (g). (g,h) DAB staining of p-AMPK and HE staining of tissue in the TAO and NC groups. Scale bar, 50 µm. n = 3 (control), n = 3 (TAO) for all. * p < 0.05, ** p < 0.01 (unpaired t test).

