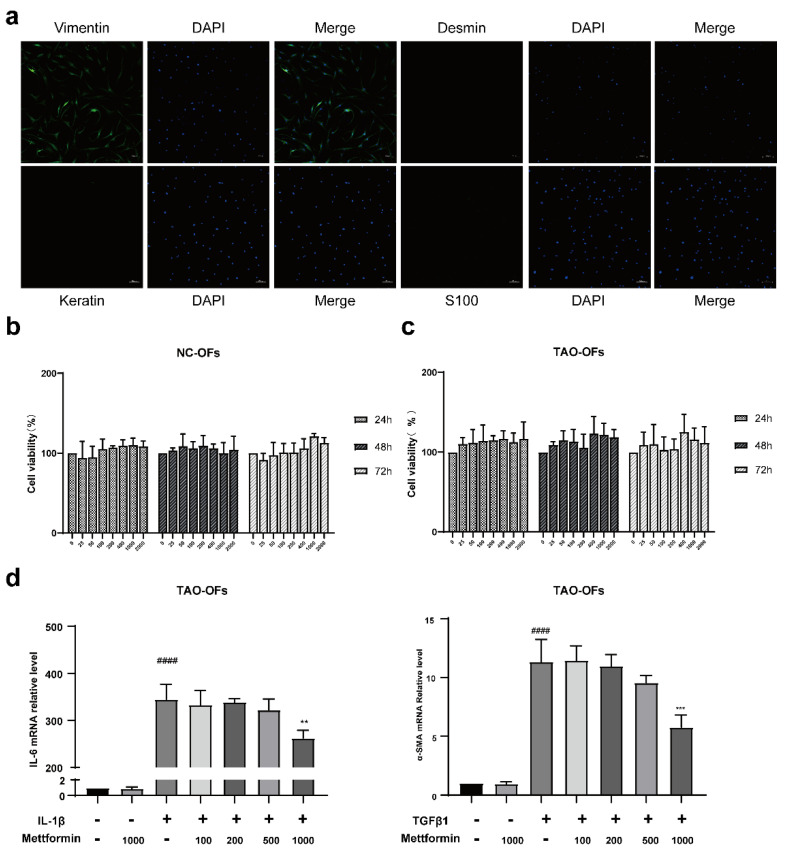
Figure 2.
Fibroblast identification and determination of metformin in vitro. (a) IF analysis of the expressions of vimentin, desmin, keratin, and s100. Scale bar, 100 µm. (b,c) CCK8 assay results showing that the different concentrations of metformin did not affect the viability of TAO and NC OFs. (d) The mRNA expressions of IL-6 and α-SMA in TAO-OFs treated with different concentrations of metformin were determined by qPCR. #### p < 0.0001, compared with the control group, ** p < 0.01, *** p < 0.001 compared with the IL-1β or TGF-β1 group (ANOVA).

