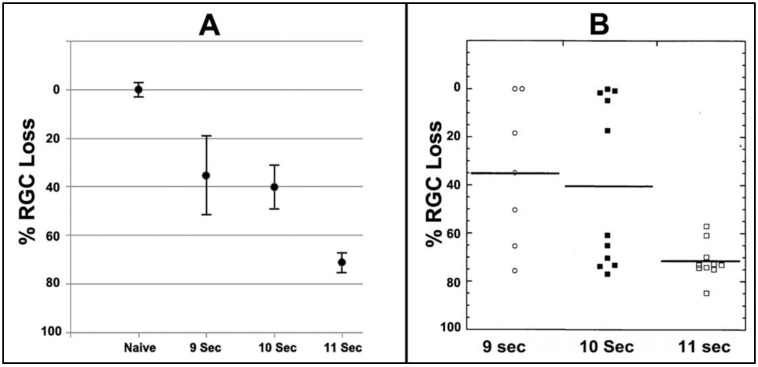
Figure 4.
RGC loss patterns with increasing amounts of laser exposure. (A). Comparison of mean RGC loss in rNAION with increasing exposure times using a 532nm laser at constant power and spot size (50 mW power; 500 um spot size). (B). Induction times compared against the range of individual animal RGC loss values. Low induction times (9 s) result in a wide range of RGC loss values, including a number of animals without any RGC loss as well as animals with minimal levels of RGC loss. An intermediate induction time (10 s) results in identification of two animal subgroups suggestive of a threshold effect, with subthreshold- (low levels of RGC loss) and threshold- animals (high-level RGC loss). A further increase in exposure time to 11 s results in the majority of animals having significant RGC loss (threshold). Data for Figure 4 is reprinted with permission from [16]. 2021 PLOS-One.

