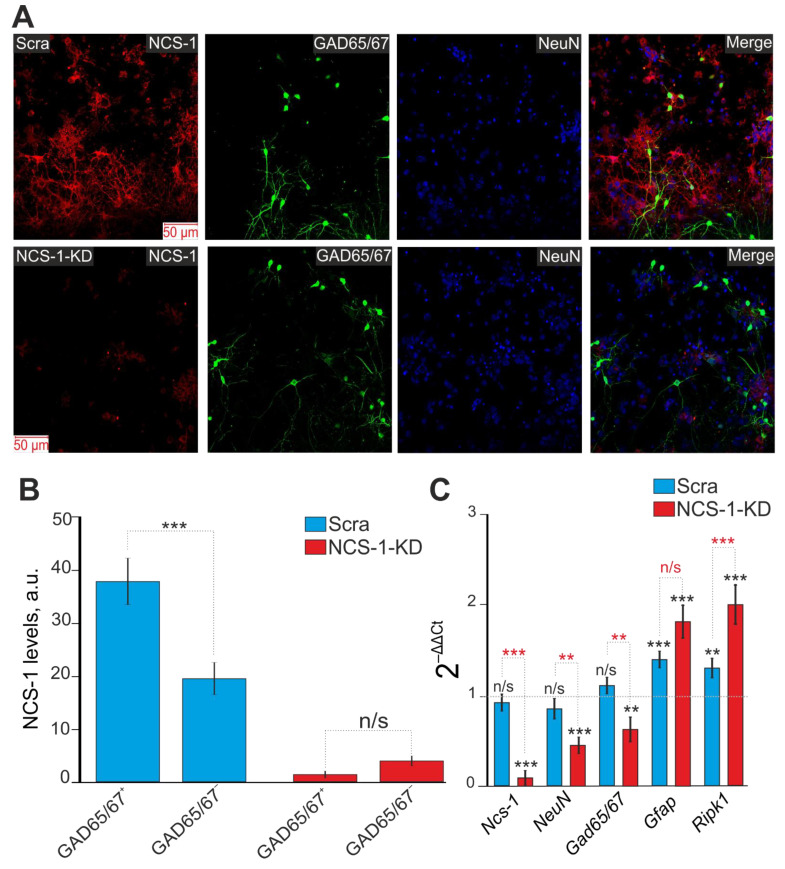
Figure 2.
Effect of NCS-1 knockdown on the level of NCS-1 in GABAergic neurons and expression of genes encoding proteins-markers of neurons (NeuN), astrocytes (Gfap) and the pathway of necrotic death. (A) Immunocytochemical staining of a cell culture of the mouse cerebral cortex with antibodies against NCS-1, GAD65/67 and NeuN in control (Scra) and in cells with NCS-1 knockdown (NCS-1). Merge—the overlay of antibody fluorescence. (B) Level of NCS-1 expression in GABAergic (GAD65/67+) and non-GABAergic (GAD65/67–) neurons of the cerebral cortex in control samples (Scra) and in cells with NCS-1-KD. Intensity levels of NCS-1 expression were determined by confocal imaging. The quantative data reflecting the level of NCS-1 expression are presented as fluorescence intensity values in summary bar charts (mean ± SEM). The values were averaged by 150 neurons for each column. We used the scans from three independent view fields for each experimental group. Statistical significance was assessed using paired t-test. (C) Level of gene expression in Scra and NCS-1-KD samples in mouse cortex cells. Gene expression in control cells (without exposure to lipofectamine and shRNA) are marked by dashed line. Comparison of experimental groups regarding control: n/s—data not significant (p > 0.05), ** p < 0.01 and *** p < 0.001. Comparison of experimental groups relative to each other is indicated in red. The number of RNA samples is 3. N (number of animals used for cell cultures preparation) = 3.

