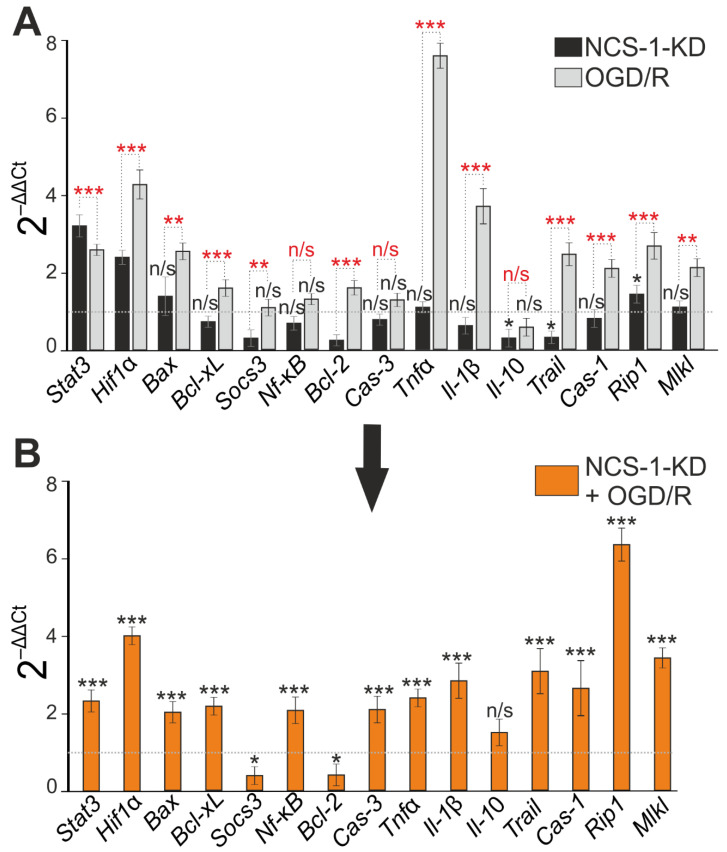
Figure 4.
Effect of NCS-1-KD and OGD/R on mRNA expression of proteins regulating apoptosis, necrosis, and inflammation. (A) Baseline mRNA expression in NCS-1-KD cortical cells (black bars) and cortical cells (Scra) 24 h after OGD/R. Dashed line level of gene expression in control (Scra without NCS-1-KD and OGD/R). (B) Effect of NCS-1-KD on OGD/R induced gene expression. Dashed line level of gene expression in OGD/R experimental group (Scra without NCS-1-KD). Statistical significance was assessed using unpaired t-test. n/s—data not significant (p > 0.05), * p < 0.05, ** p < 0.01, and *** p < 0.001. Comparison between experimental group NCS-1-KD and experimental group OGD/R is marked by red asterisks. In panel (A), columns without black asterisks—differences are significant *** p < 0.001. The number of samples is 4. N (number of animals used for cell cultures preparation) = 4.

