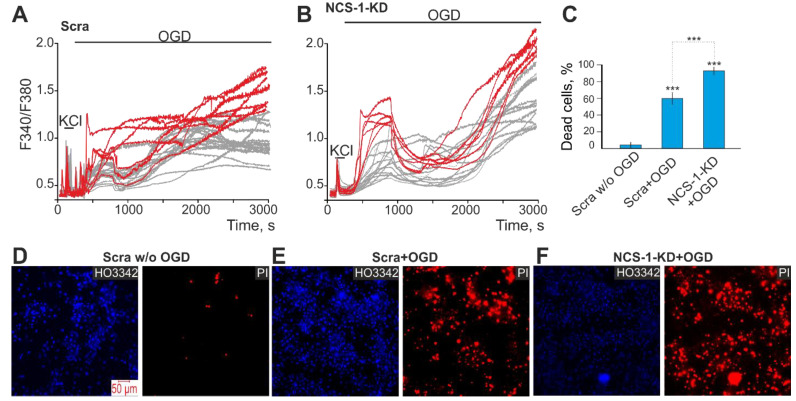
Figure 5.
Effect of NCS-1-KD on OGD-induced Ca2+-signals of non-GABAergic (GAD65/67–) and GABAergic neurons of the cerebral cortex and their death. (A, B) Ca2+-signals of GABAergic (red curves) and GAD65/67– (gray curves) neurons during a 40-min OGD in control (Scra, (A)) and after NCS-1-KD (NCS-1-KD, (B)). (C) The average number of PI-stained cortical cells that died due to OGD-induced necrosis in the Scra-group and NCS-1-KD-group. Statistical significance was assessed using paired t-test. Comparison Scra + OGD and NCS-1-KD + OGD with Scra w/o OGD significant, *** p-level < 0.001. (D–F) Images of cortical cell culture in the Hoechst 33,342 (HO342) and Propidium Iodide (PI) fluorescence detection channel in the experimental group without OGD ((D) Scra w/o OGD) and after 40-min OGD treatment in Scra group ((E) Scra + OGD) and neuronal calcium sensor-1 knockdown group ((F) NCS-1-KD + OGD). The red dots represent the PI-stained nuclei of necrotic cells. The number of samples is 6. N (number of animals used for cell cultures preparation) = 3.

