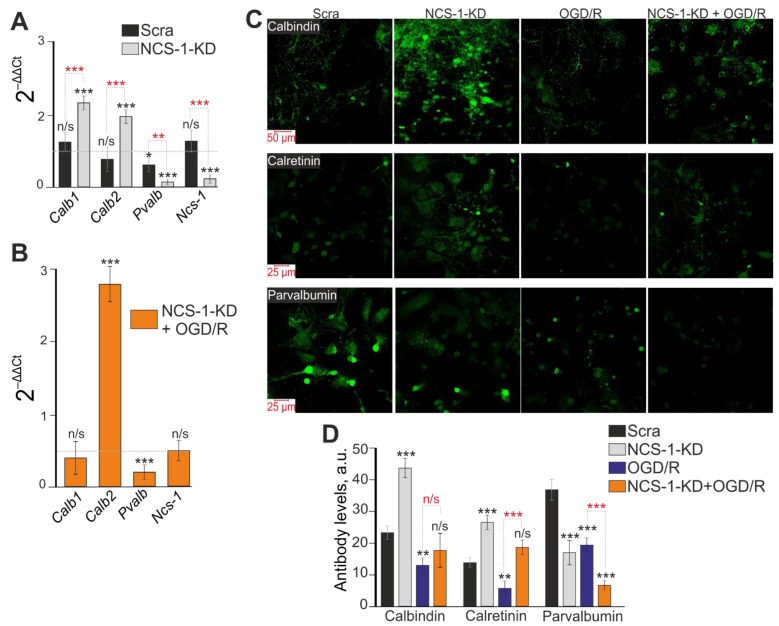
Figure 6.
Effect of NCS-1-KD on basal and OGD/R-induced expression of calcium-binding proteins calbindin (Calb1), calretinin (Calb2), and parvalbumin (Pvalb). (A) Basic expression of genes encoding calcium-binding proteins in the Scra experimental group (siRNA, which sequence differed from the sequence of siRNA against NCS-1) and NCS-1-KDcells (NCS-1-KD). Dashed line level of gene expression in control. Statistical significance was assessed using paired t-test compared to Control cells (marked with black asterisks). Comparison between experimental group Scra and experimental group NCS-1KD is marked by red asterisks. n/s—data not significant (p > 0.05), * p < 0.05, ** p < 0.01, and *** p < 0.001. (B) Effect of NCS-1-KD on OGD/R-induced expression of genes encoding calcium-binding proteins. Dashed line level of gene expression in OGD/R group (Scra without NCS-1 knockdown). Statistical significance was assessed using paired t-test. n/s—data not significant (p > 0.05) and *** p < 0.001. (C) Immunostaining cortical cells with antibodies against Calbindin, Calretinin and Parvalbumin in control (Scra), NCS-1-KDgroup (NCS-1-KD), 24 h after OGD/R in control group (OGD/R) and cells with NCS-1-KD (NCS-1-KD + OGD/R). (D) Intensity levels of antibodies were determined by confocal imaging. We analyzed individual cells which had fluorescence of secondary antibodies. The quantitative data reflecting the level of Calbindin, Calretinin and Parvalbumin expression are presented as fluorescence intensity values in summary bar charts (mean ± SEM). The values were averaged by 100 cells for each column. The results obtained after immunostaining agree well with the data of fluorescent presented in panels (C). Statistical significance was assessed using paired t-test compared to Scra (marked with black asterisks). Comparison between experimental group OGD/R and experimental group NCS-1KD+OGD/R is marked by red asterisks. n/s—data not significant (p > 0.05), ** p < 0.01, and *** p < 0.001. For repeats, 4 separate cell cultures were used. N (number of animals used for cell cultures preparation) = 4.

