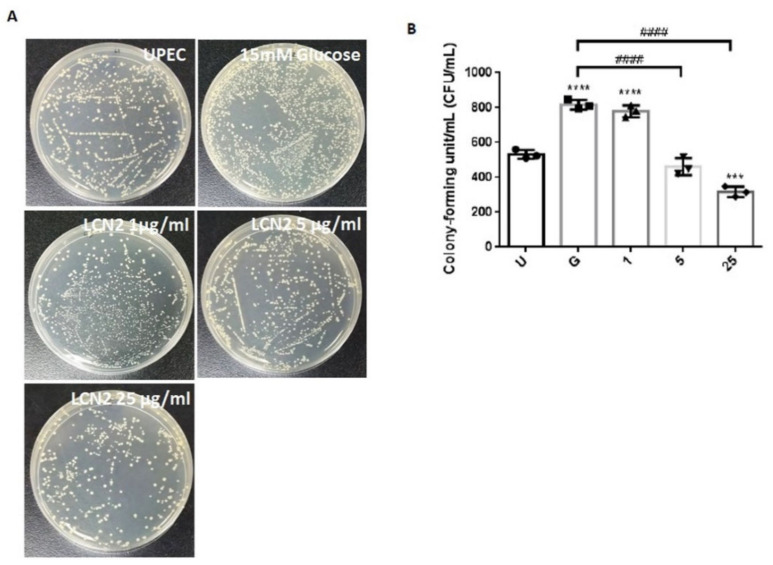
Figure 1.
LCN2 suppression of UPEC infections in bladder cells in a high-glucose environment. SV-HUC-1 cells were first pretreated with 15 mM glucose, followed by treatments with different concentrations of LCN2 (1, 5, and 25 μg/mL) for 24 h and infection with pGFP-UPEC (MOI of 1:100) for 4 h, as described in the text. The definitions of the letters on the X axis: U, UPEC infection alone; G, with 15 mM glucose pretreatment alone. UPEC infections in bladder cells were examined by plating cells on NB agar (A) and were determined using ImageJ software (B). Colony-forming units/mL (CFUs/mL) were acquired after plating out lysed solutions of infected cells. The picture shown is representative of a typical result. The data are expressed as the means SDs of three independent experiments. An analysis of variance was used to evaluate differences between various treatment groups and controls. Statistical differences between groups were determined using the Mann–Whitney U Student’s t-test. Statistical significance was set at p < 0.05. *** p < 0.001, **** p < 0.0001 compared to the positive control groups. #### p < 0.0001 for comparisons between two groups.

