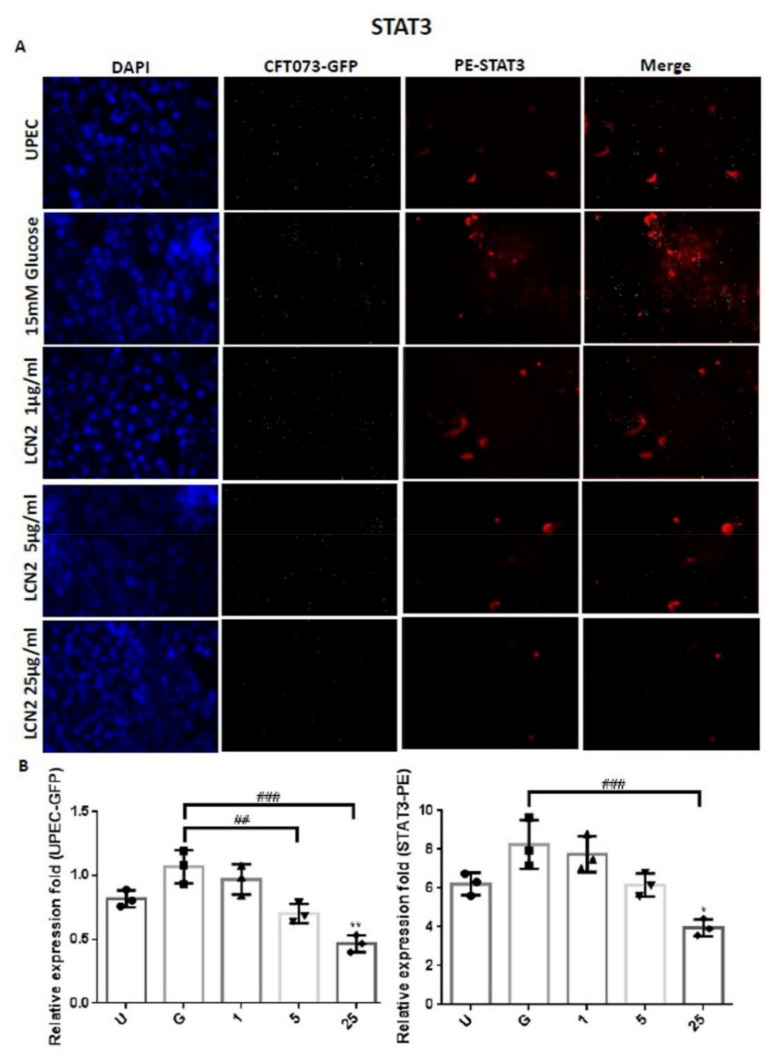
Figure 3.
LCN2 decreased UPEC infections and STAT3 expression in bladder cells. SV-HUC-1 cells were first pretreated with 15 mM glucose, followed by treatment with different concentrations of LCN2 (1, 5, and 25 μg/mL) for 24 h and infection with pGFP-UPEC (MOI of 1:100) for 4 h, as described in the text. The definitions of the letters on the X axis: U, UPEC infection alone; G, with 15 mM glucose pretreatment alone. GFP-UPEC and PE-STAT3 expression in SV-HUC-1 cells, for 4 h postinfection, were (A) observed by fluorescence microscopy and (B) measured using ImageJ software. Cells infected with UPEC alone were used as positive controls. The pictures shown are representative of typical results. DAPI was used to count the number of cells and as a standard for calculating the fluorescence expression ratios of cells. Cell images were captured using a microscope (Leica) at 100× magnification. The data are expressed as means ± SDs from three separate experiments. An analysis of variance was used to evaluate differences between various treatment groups and controls. Statistical differences between groups were determined using the Mann–Whitney U Student’s t-test. Statistical significance was set at p < 0.05. * p < 0.05, ** p < 0.01 compared to the positive control groups. ## p < 0.01, ### p < 0.001 for comparisons between two groups.

