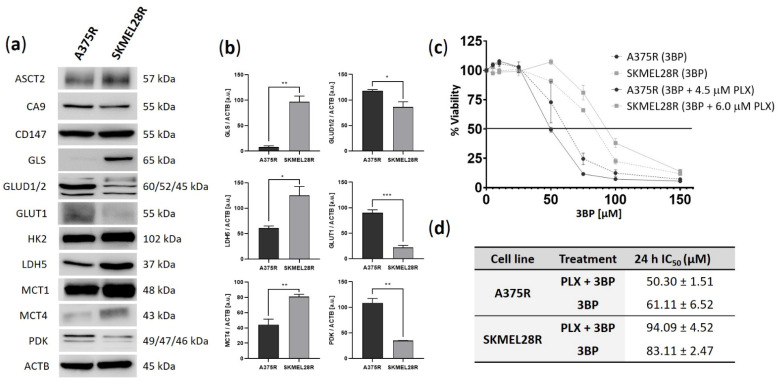
Figure 1.
Basal expression of metabolic proteins and cell viability analysis using a sulforhodamine B (SRB) assay in vemurafenib (PLX)-resistant melanoma cells treated with 3-bromopyruvate (3BP) for 24 h. (a) Western blot analysis of the basal levels of ASCT2, CA9, CD147, GLS, GLUD1/2, GLUT1, HK2, LDH5, MCT1, MCT4, and PDK in PLX-resistant melanoma cells. (b) Quantification of immunoblots normalized to ACTB levels. The y-axis represents arbitrary units [a.u.]. Data represent the mean ± SEM of at least three independent experiments. (c) The dose–response curve represents the viability of PLX-resistant melanoma cells treated with 0–150 µM 3BP, either alone or combined with PLX (4.5 µM for A375R cells and 6.0 µM for SKMEL28R cells). Data were normalized to the vehicle control (100%). (d) IC50 values of PLX-resistant melanoma cells treated with 3BP for 24 h. Data represent the mean ± SEM of at least three independent experiments performed in triplicate. * p ≤ 0.05; ** p ≤ 0.01; *** p ≤ 0.001.

