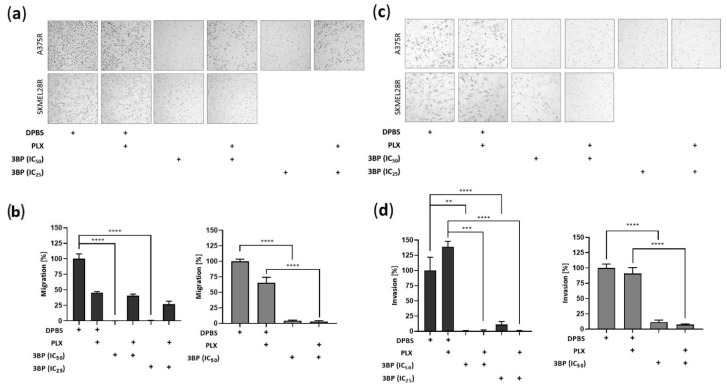
Figure 5.
Migration and invasion analysis using the transwell assay in vemurafenib (PLX)-resistant melanoma cells treated with 3-bromopyruvate (3BP) for 24 h. PLX-resistant melanoma cells were treated with IC25 or IC50 3BP, either alone or in combination with PLX (4.5 µM for A375R cells and 6.0 µM for SKMEL28R cells), for 24 h. (a) representative migratory PLX-resistant melanoma cells stained with hematoxylin and eosin; (b) graphic representation of migratory cell count; (c) representative invasive PLX-resistant melanoma cells stained with hematoxylin and eosin; (d) graphic representation of invasive cell count. Data were normalized to the vehicle control (100%). Dark gray represents A375R cells; light gray represents SKMEL28R cells. The positive signs in the bar charts indicate the presence of a defined treatment. Data represent the mean ± SEM of at least three independent experiments performed in triplicate. ** p ≤ 0.01; *** p ≤ 0.001; **** p ≤ 0.0001.

