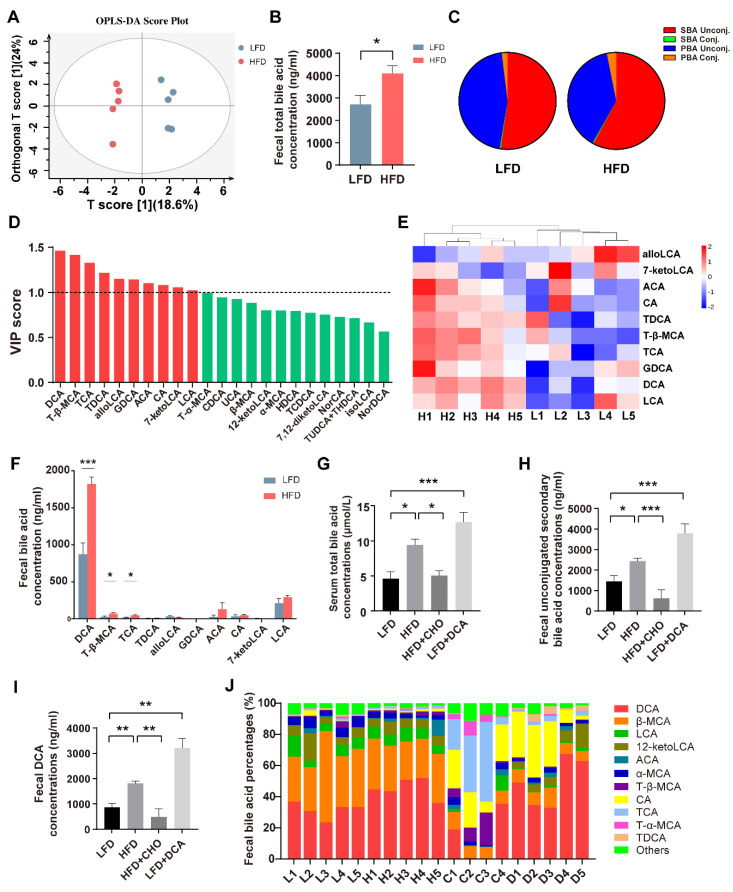
Figure 1.
High-fat feeding induces disorder of the bile acid pool and increases DCA levels. (A) Orthogonal partial least squares discriminant analysis (OPLS-DA) of faeces in the LFD and HFD groups. R2Y = 0.983, Q2 = 0.647. (B–E) Comparison of faecal bile acids in total bile acid concentrations (B), the bile acid composition ratio (C), variable importance of projection (VIP) value (red bars: VIP > 1) (D), heat map of bile acids with VIP > 1 (E), and individual bile acid concentrations (F) in the LFD and HFD groups (n = 5). (G) Serum total bile acid concentrations in the LFD, HFD, HFD + CHO, and LFD + DCA groups (n = 5). (H–J) Faecal bile acid in secondary unconjugated bile acid concentrations (H), DCA concentrations (I), and the bile acid composition ratio (J) in the LFD, HFD, HFD + CHO, and LFD + DCA groups (n = 4–5). Data are shown as the mean ± SEM. Unconj., unconjugated; Conj., conjugated; LFD, low-fat diet; HFD, high-fat diet; DCA, deoxycholic acid; CHO, cholestyramine; L, LFD; H, HFD; C, HFD + cholestyramine; D, LFD + deoxycholic acid. * p < 0.05; ** p < 0.01; *** p < 0.001.

