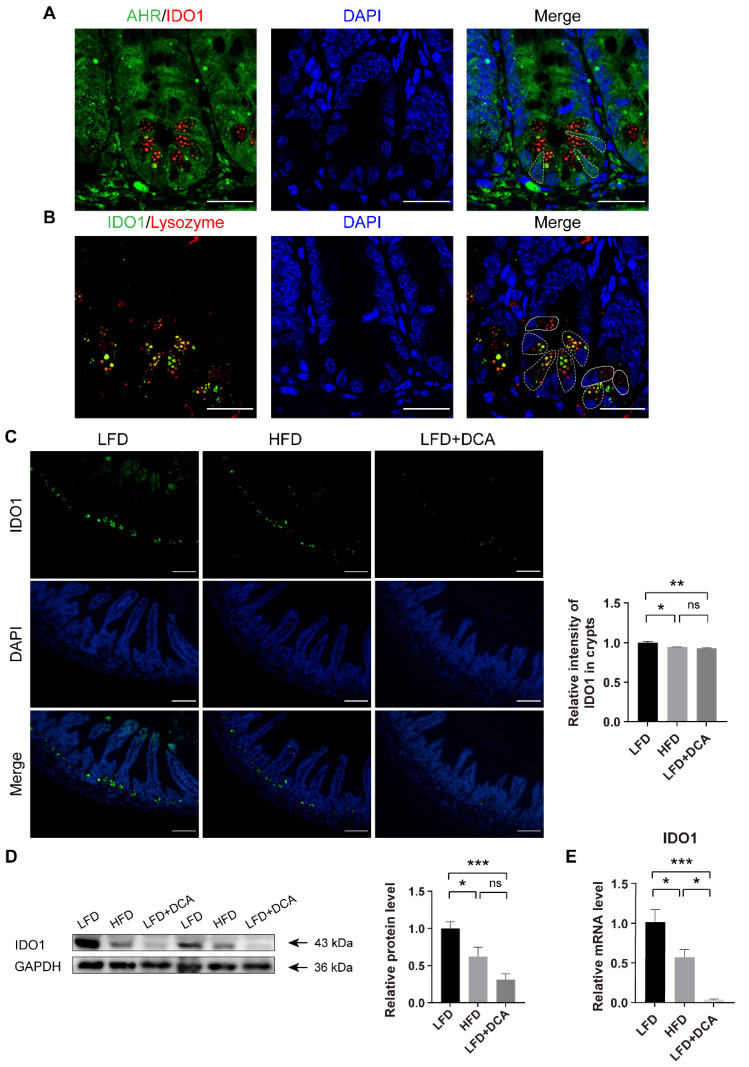
Figure 6.
DCA downregulates IDO1 in PCs in intestinal crypts. (A) Immunofluorescence staining of DAPI (blue), lysozyme (red) and IDO1 (green) showed that IDO1 was expressed in low-AHR fluorescence intensity areas in ileal crypts. The white dashed line indicates the location of the ISCs; scale bars, 25 μm. (B) Immunofluorescence staining of DAPI (blue), lysozyme (red) and IDO1 (green) showed that IDO1 was expressed in PCs. The white dashed line indicates IDO1+ PCs, and the white line indicates IDO1− PCs; scale bars, 25 μm. (C) Representative immunofluorescence images of IDO1 and analysis of fluorescence intensity in different groups (n = 5); scale bars, 100 μm. (D) Relative protein levels of IDO1 in ileal tissue and analysis in different groups (n = 7). (E) Relative mRNA levels of IDO1 in ileal tissue (n = 5) in different groups. Data are shown as the mean ± SEM. PCs, Panteh cells; AHR, aryl hydrocarbon receptor; IDO1, indoleamine 2,3-dioxygenase 1; LFD, low-fat diet; HFD, high-fat diet; DCA, deoxycholic acid. * p < 0.05; ** p < 0.01; *** p < 0.001; ns, no significant difference.

