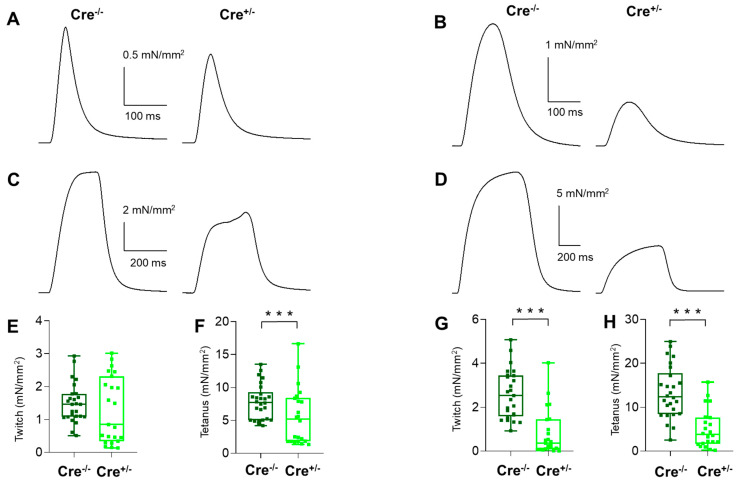
Figure 2.
Altered isometric force in EDL and SOL muscle from Cre+/− mice. Representative twitch (A,B) and tetanic force (C,D) transients in EDL (A,C) and in SOL (B,D). The force was normalized to the cross section of the muscle. Box plots show the individual data points for the peak twitch (E,G) and tetanic (F,H) force in EDL (E,F) and SOL (G,H) from Cre−/− (N = 13 mice, n = 26/25 muscles) and Cre+/− (N = 14 mice, n = 22 muscles). *** p < 0.001.

