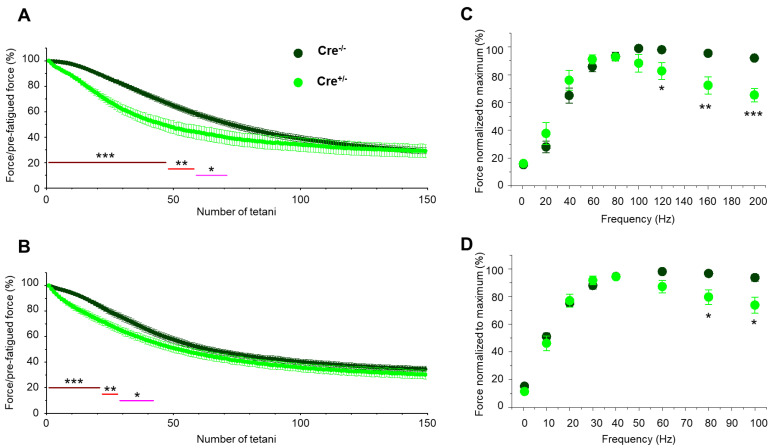
Figure 3.
Altered fatigability and activation of EDL and SOL muscles in Cre+/− mice. Fatigue in EDL (A) and in SOL (B) muscles from Cre−/− (N = 13) and Cre+/− (N = 14) mice. Magenta, red, and dark red line show the interval where Cre+/− data is significantly different from Cre−/− at p < 0.05, p < 0.01, and p < 0.001, respectively. Force-frequency relationship in EDL (C) and in SOL (D) muscles from Cre−/− (N = 4) and Cre+/− (N = 4) mice. * p < 0.05, ** p < 0.01, *** p < 0.001.

