Figure 4.
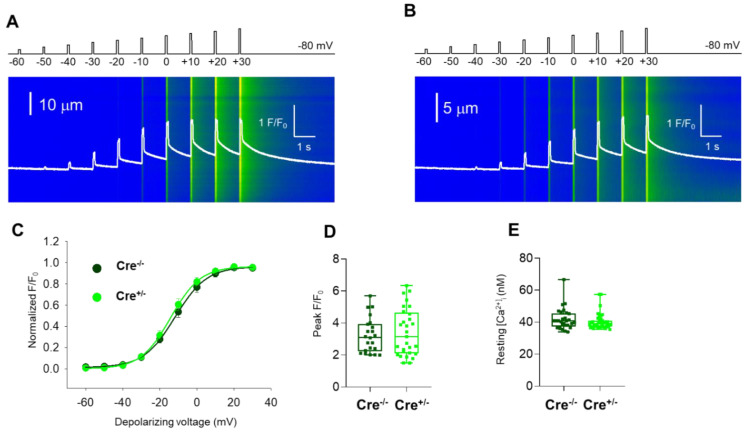
Unaffected resting intracellular calcium levels and release channel sensitivity to activation in fibers from Cre+/− mice. Intracellular Ca2+ transients were recorded under whole-cell voltage clamp following Rhod-2 loading, with 100 ms-long gradually increasing membrane depolarization ranging between −60 mV and +30 mV, with 10 mV increments applied every 500 ms in single FDB fibers from Cre−/− (A) and Cre+/− (B) mice. Fluorescence was normalized to average resting F0(x). The white traces illustrate the spatially averaged F(t)/F0. (C) Data points represent the normalized maximal fluorescence at the given depolarization in 21 Cre−/− and 27 Cre+/− FDB muscle fibers obtained from 6 animals in each group. The voltage dependence of the normalized fluorescence was well fitted by a Boltzmann function using Equation (1). The mean values of parameters V50 and k were not significantly different: V50 (Cre−/−): −11.73 ± 2.1 mV, k (Cre−/−): 8.49 ± 0.6 mV, and V50 (Cre+/−): −14.11 ± 2.4 mV, k (Cre+/−): 7.99 ± 0.6 mV. (D) Box plot distribution of the average peak of calcium transients elicited by single 100 ms-long depolarizations to +30 mV in Cre−/− (n = 21 cells, N = 6 mice) and Cre+/− fibers (n = 27 cells, N = 6 mice). The average peak F/F0 values were: 3.22 ± 0.23 and 3.41 ± 0.27. (E) Box plot representation of the resting intracellular calcium concentration as measured by Fura-2 ratiometric dye. The average resting calcium concentration values were: 41.8 ± 6.6 nM for Cre−/− (n = 29 cells) and 40.3 ± 4.9 nM for Cre+/− (n = 40 cells), respectively.

