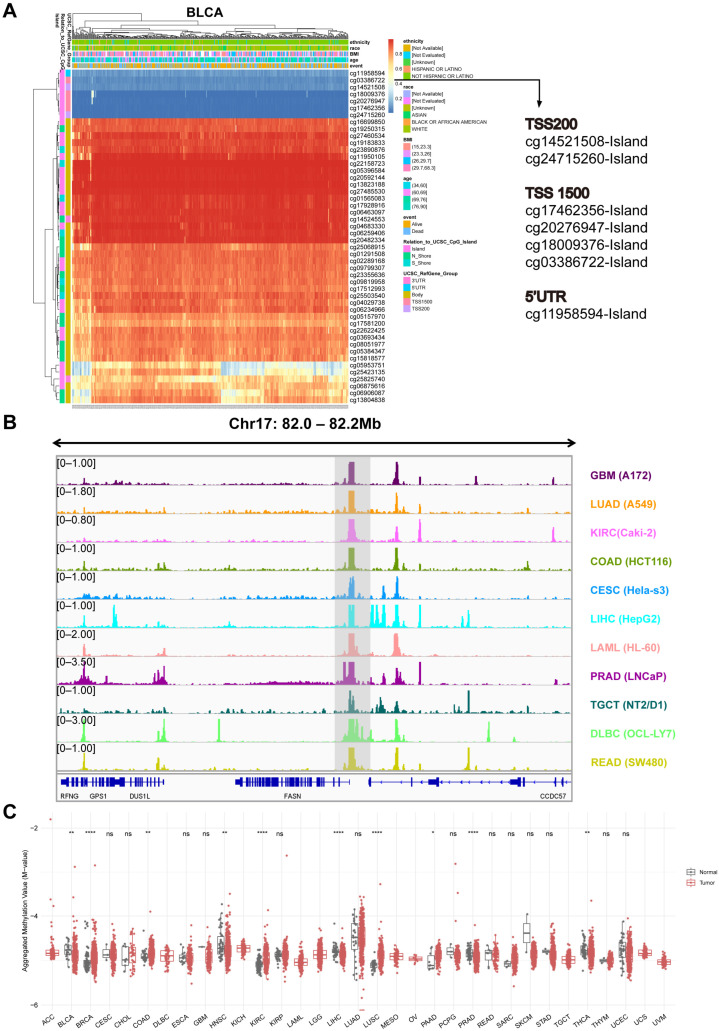
Figure 7.
DNA methylation analysis of FASN promoter. (A) Distribution of DNA methylation at the FASN locus in the representative cancer BLCA. (B) DNase-seq data in eleven cancers obtained from the ENCODE database were visualized using the integrative genomics viewer, coordinates were located at the FASN locus, and the peaks of the target are shown in shaded areas. (C) Differences in aggregated methylation of seven methylation probes (cg24715260, cg14521508, cg17462356, cg20276947, cg18009376, cg03386722, cg11958594) of FASN in multiple cancers. (* p < 0.05, ** p < 0.01, **** p < 0.001).

