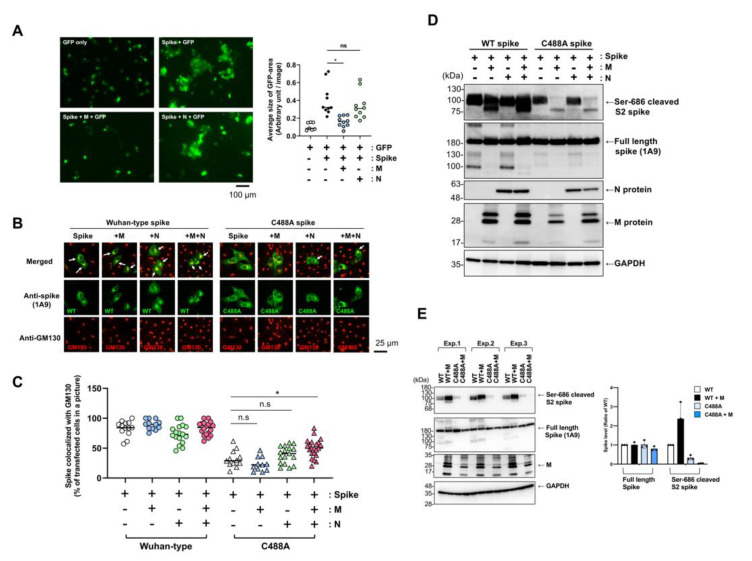
Figure 4.
M protein did not affect C488A-mutant spike. (A) VeroE6/TMPRSS2 cells were co-transfected with spike-, M-, N-expressing plasmids with pEGFP-C1. The cells were fixed at 20 h post-transfection, and the green fluorescence protein (GFP) signals were photographed with conventional fluorescence microscopy. Areas of GFP-positive green cells were measured in each picture by ImageJ software, and average area size of GFP-positive cells in a picture was plotted in the right graph. One-way ANOVA with Tukey-HSD was performed to assess statistical significance. n.s. means “not significant”, and * indicates p < 0.01. (B) Spike-expressing plasmids were co-transfected with SARS-CoV-2 M or N protein-expressing plasmid in Vero cells, which were fixed and permeabilized. Co-localization of spikes (green) with GM130 (red) were analyzed by confocal microscopy. White arrows indicate complete co-localization (yellow) of spikes with GM130. (C) Co-localization of spikes and GM130 was examined in the transfected cells (n ≥ 156), and the ratio of co-localization is shown. One-way ANOVA with Tukey-HSD was performed to assess statistical significance. n.s. means “not significant”, and * indicates p < 0.01. (D,E) SARS-CoV-2 spike-expressing plasmid was co-transfected with M- or N-expressing plasmid in HEK293T cells. The cell lysate was prepared after 20 h, and full-length and Ser-686 cleaved spike proteins were detected by Western blotting with anti-spike (1A9) and cleaved SARS-CoV-2 spike (Ser686) antibodies, respectively. Triplicated transfected samples were analyzed (Exp. 1–3), and signal intensity was quantified by ImageJ (right graph in E).

