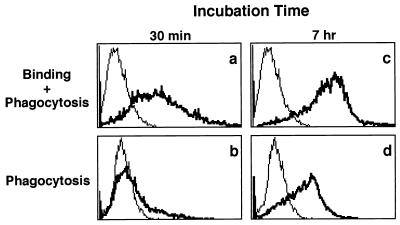
FIG. 6.
Flow-cytometric analysis of phagocytosis of FITC–BCG-CWS by iDC. iDC were incubated for 0.5 or 7 h in medium with GM-CSF (500 IU/ml) and FITC–BCG-CWS (15 μg/ml). Thin lines show self-fluorescence of cells, and bold lines reflect fluorescence of FITC-BCG-CWS particles which are bound and/or phagocytosed. Total fluorescence intensities (panels a and c) and those quenched with trypan blue (panels b and d) are shown. This experiment was repeated three times with similar results, and representative results are shown.

