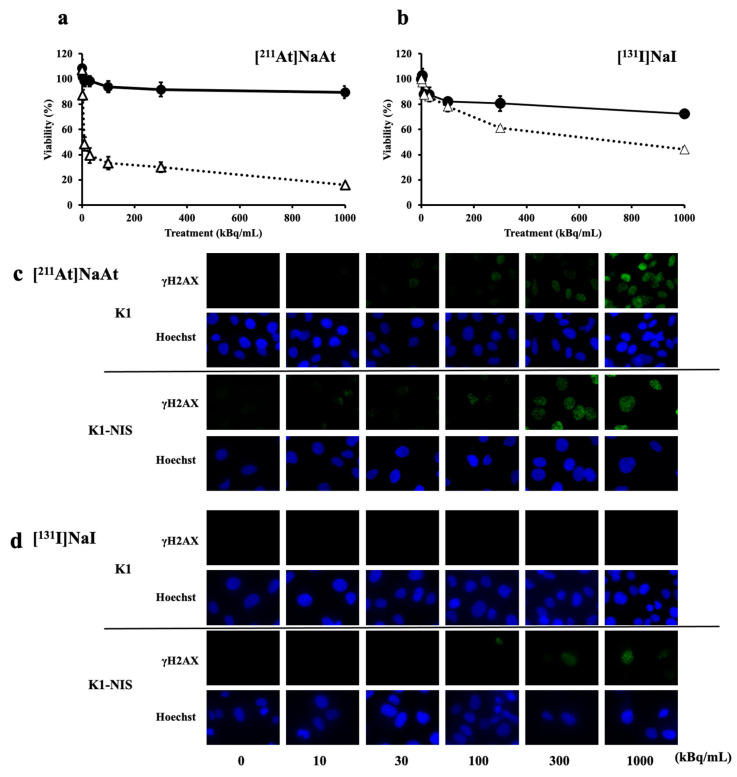
Figure 2.
Viability of K1 or K1-NIS cells treated with [211I]NaAt (a) and [131I]NaI (b) solutions. Black circles represent K1 cells and white triangles represent K1-NIS cells. Data was shown in mean ± S.D. DSB induction of K1 or K1-NIS cells treated with [211I]NaAt (c) and [131I]NaI (d) solutions. Green fluorescence indicates γH2AX and blue fluorescence indicates nuclei.

